Political affiliation is far more closely associated with immigration policy preferences than race or ethnicity, polling finds.
The connections generated by globalization complicate narratives surrounding immigration and diversity. The US is also more racially diverse than ever and national security is shifting, politicized, and tied to identity. In this context, how do different groups understand immigration and diversity? To better understand these relationships, the Chicago Council on Global Affairs and the New America Foundation have partnered to conduct novel research on the views of Black, Asian, Hispanic, and Native Americans as part of the 2022 Chicago Council Survey.
Key Findings
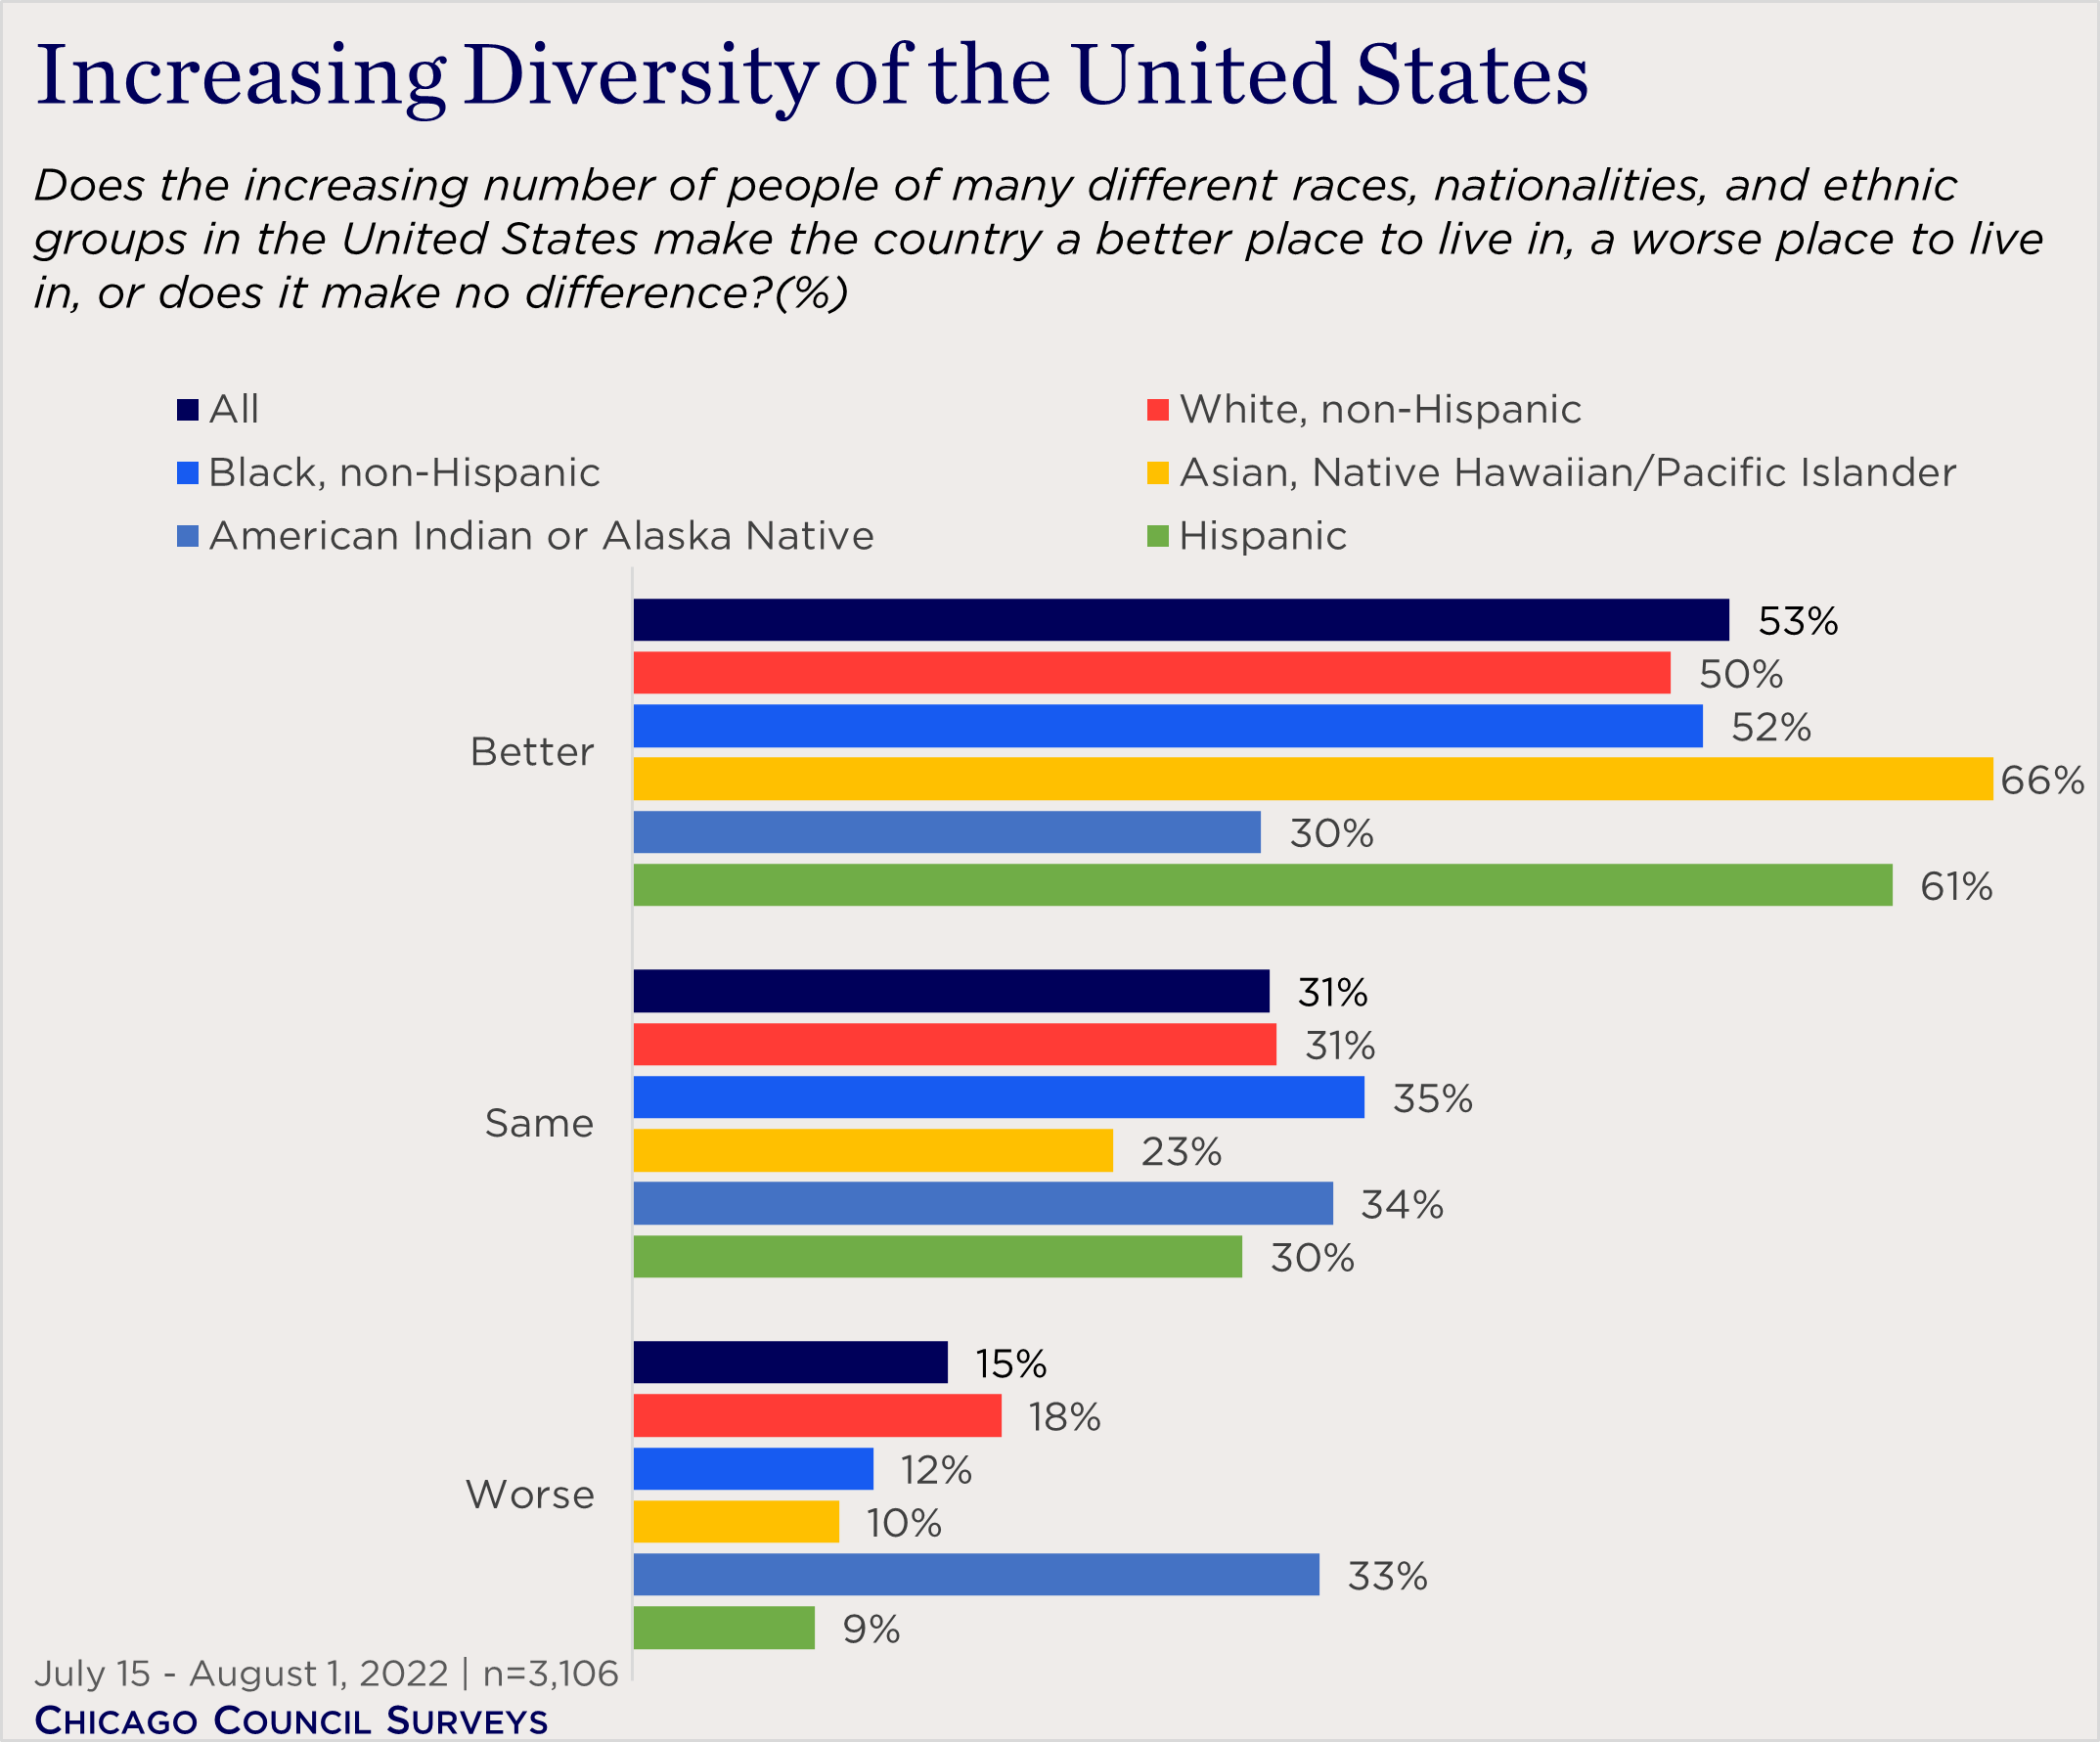
- While a slight majority (53%) of all Americans say that growing diversity makes the country a better place to live, Asian Americans (66%) and Hispanic Americans (61%) are the most likely to agree.
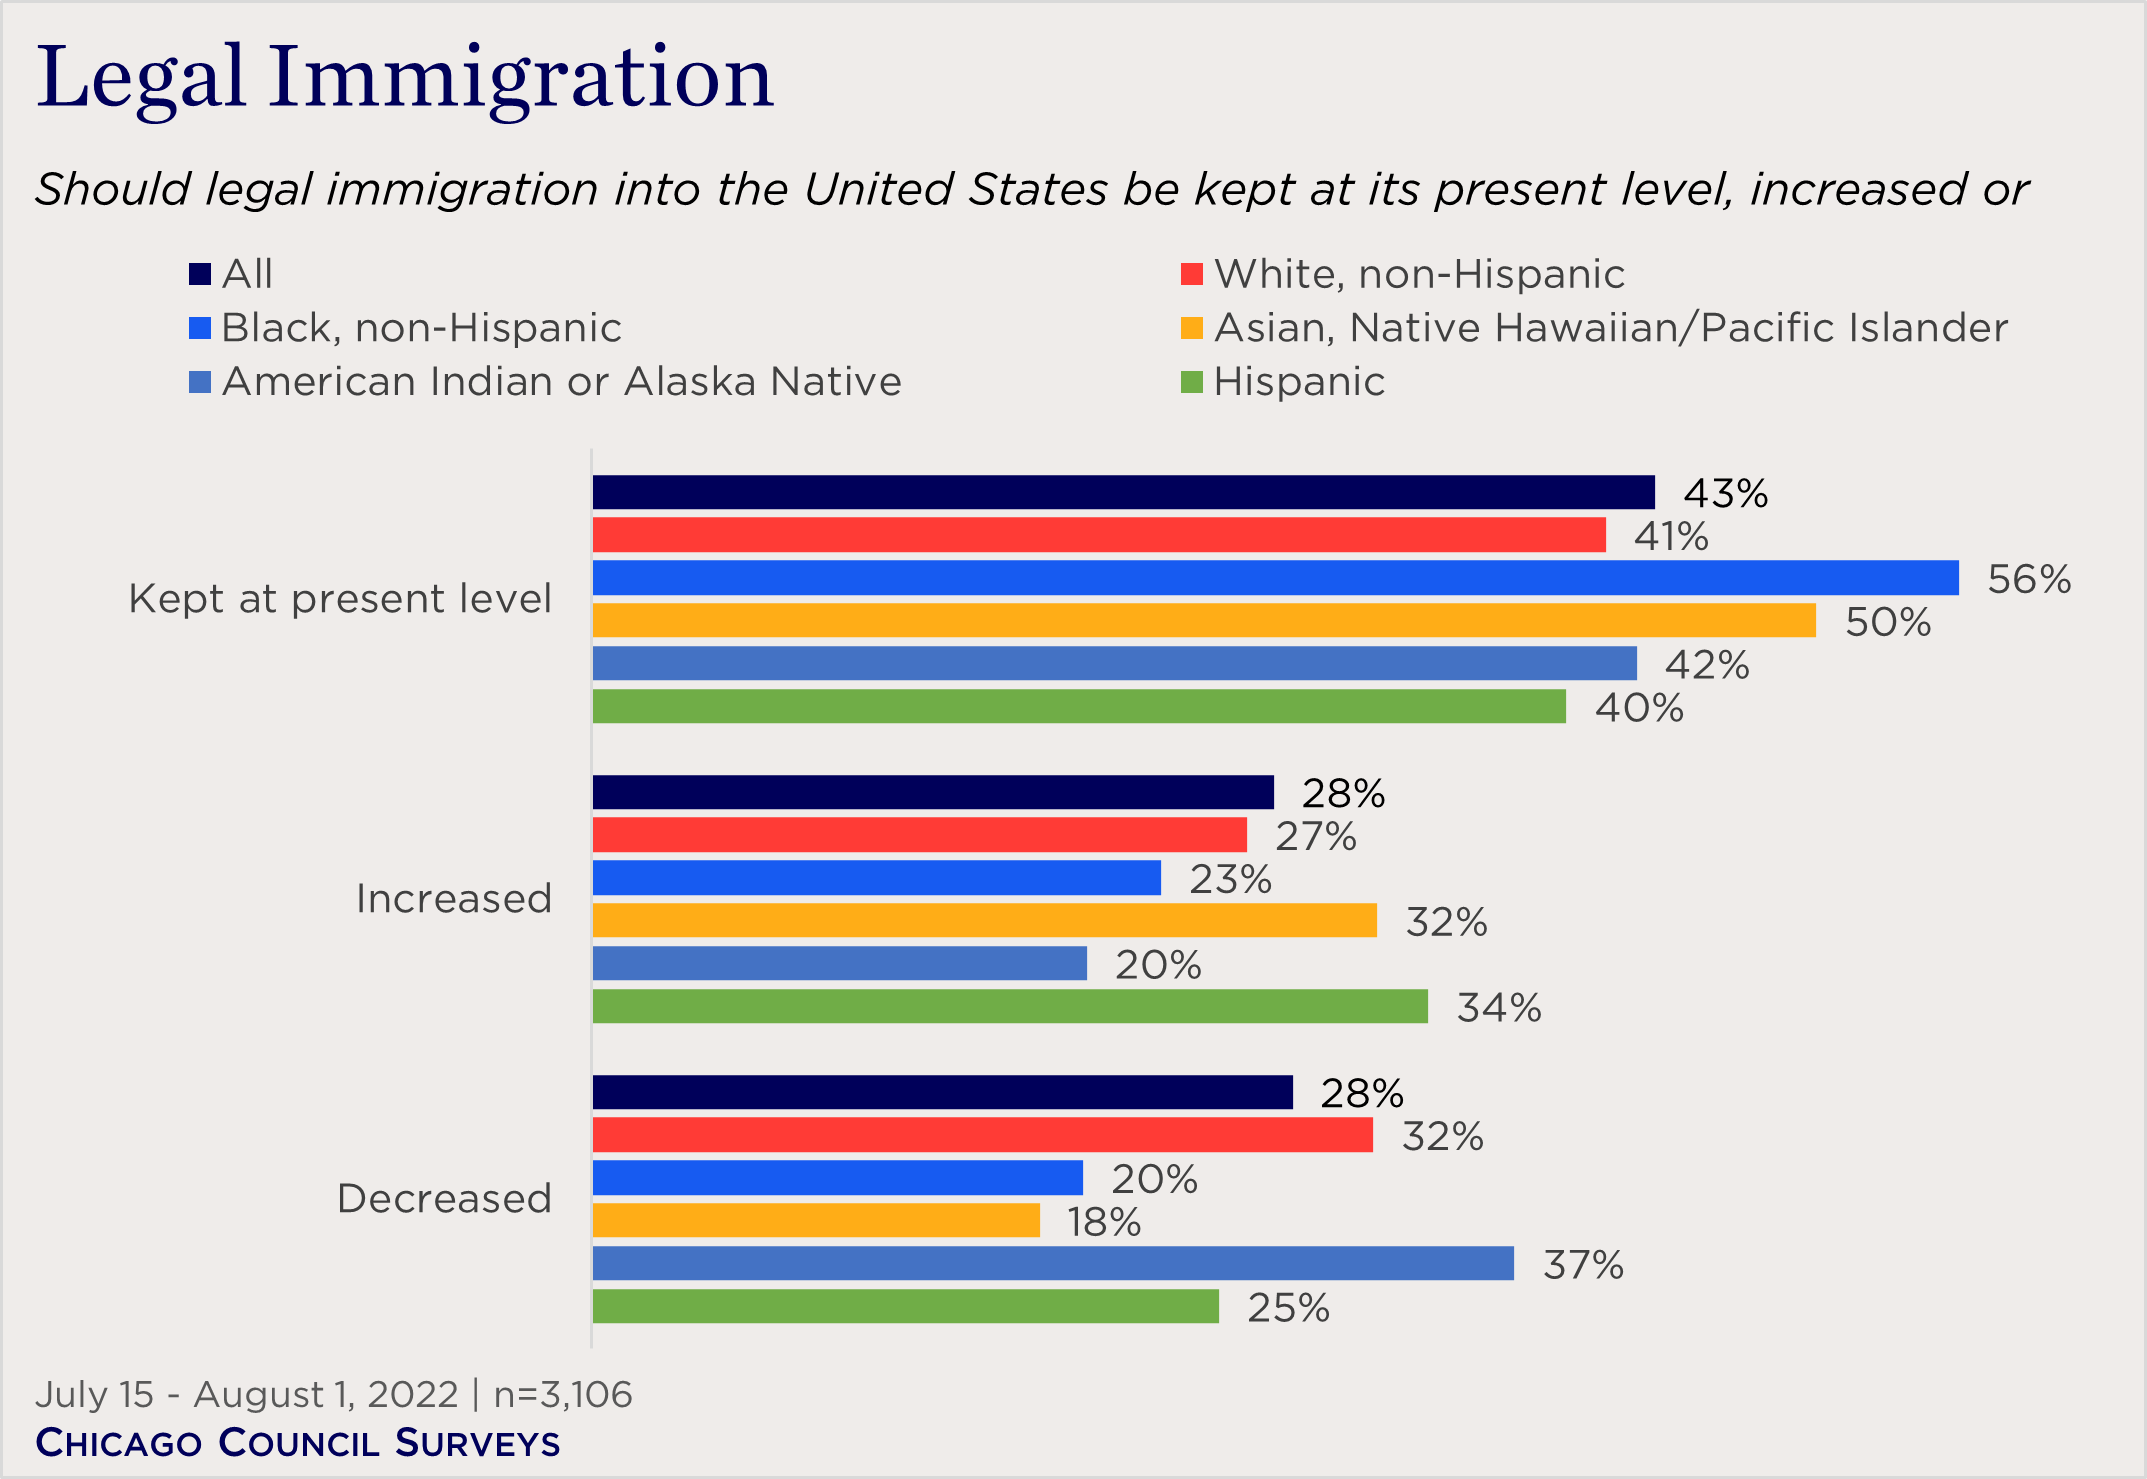
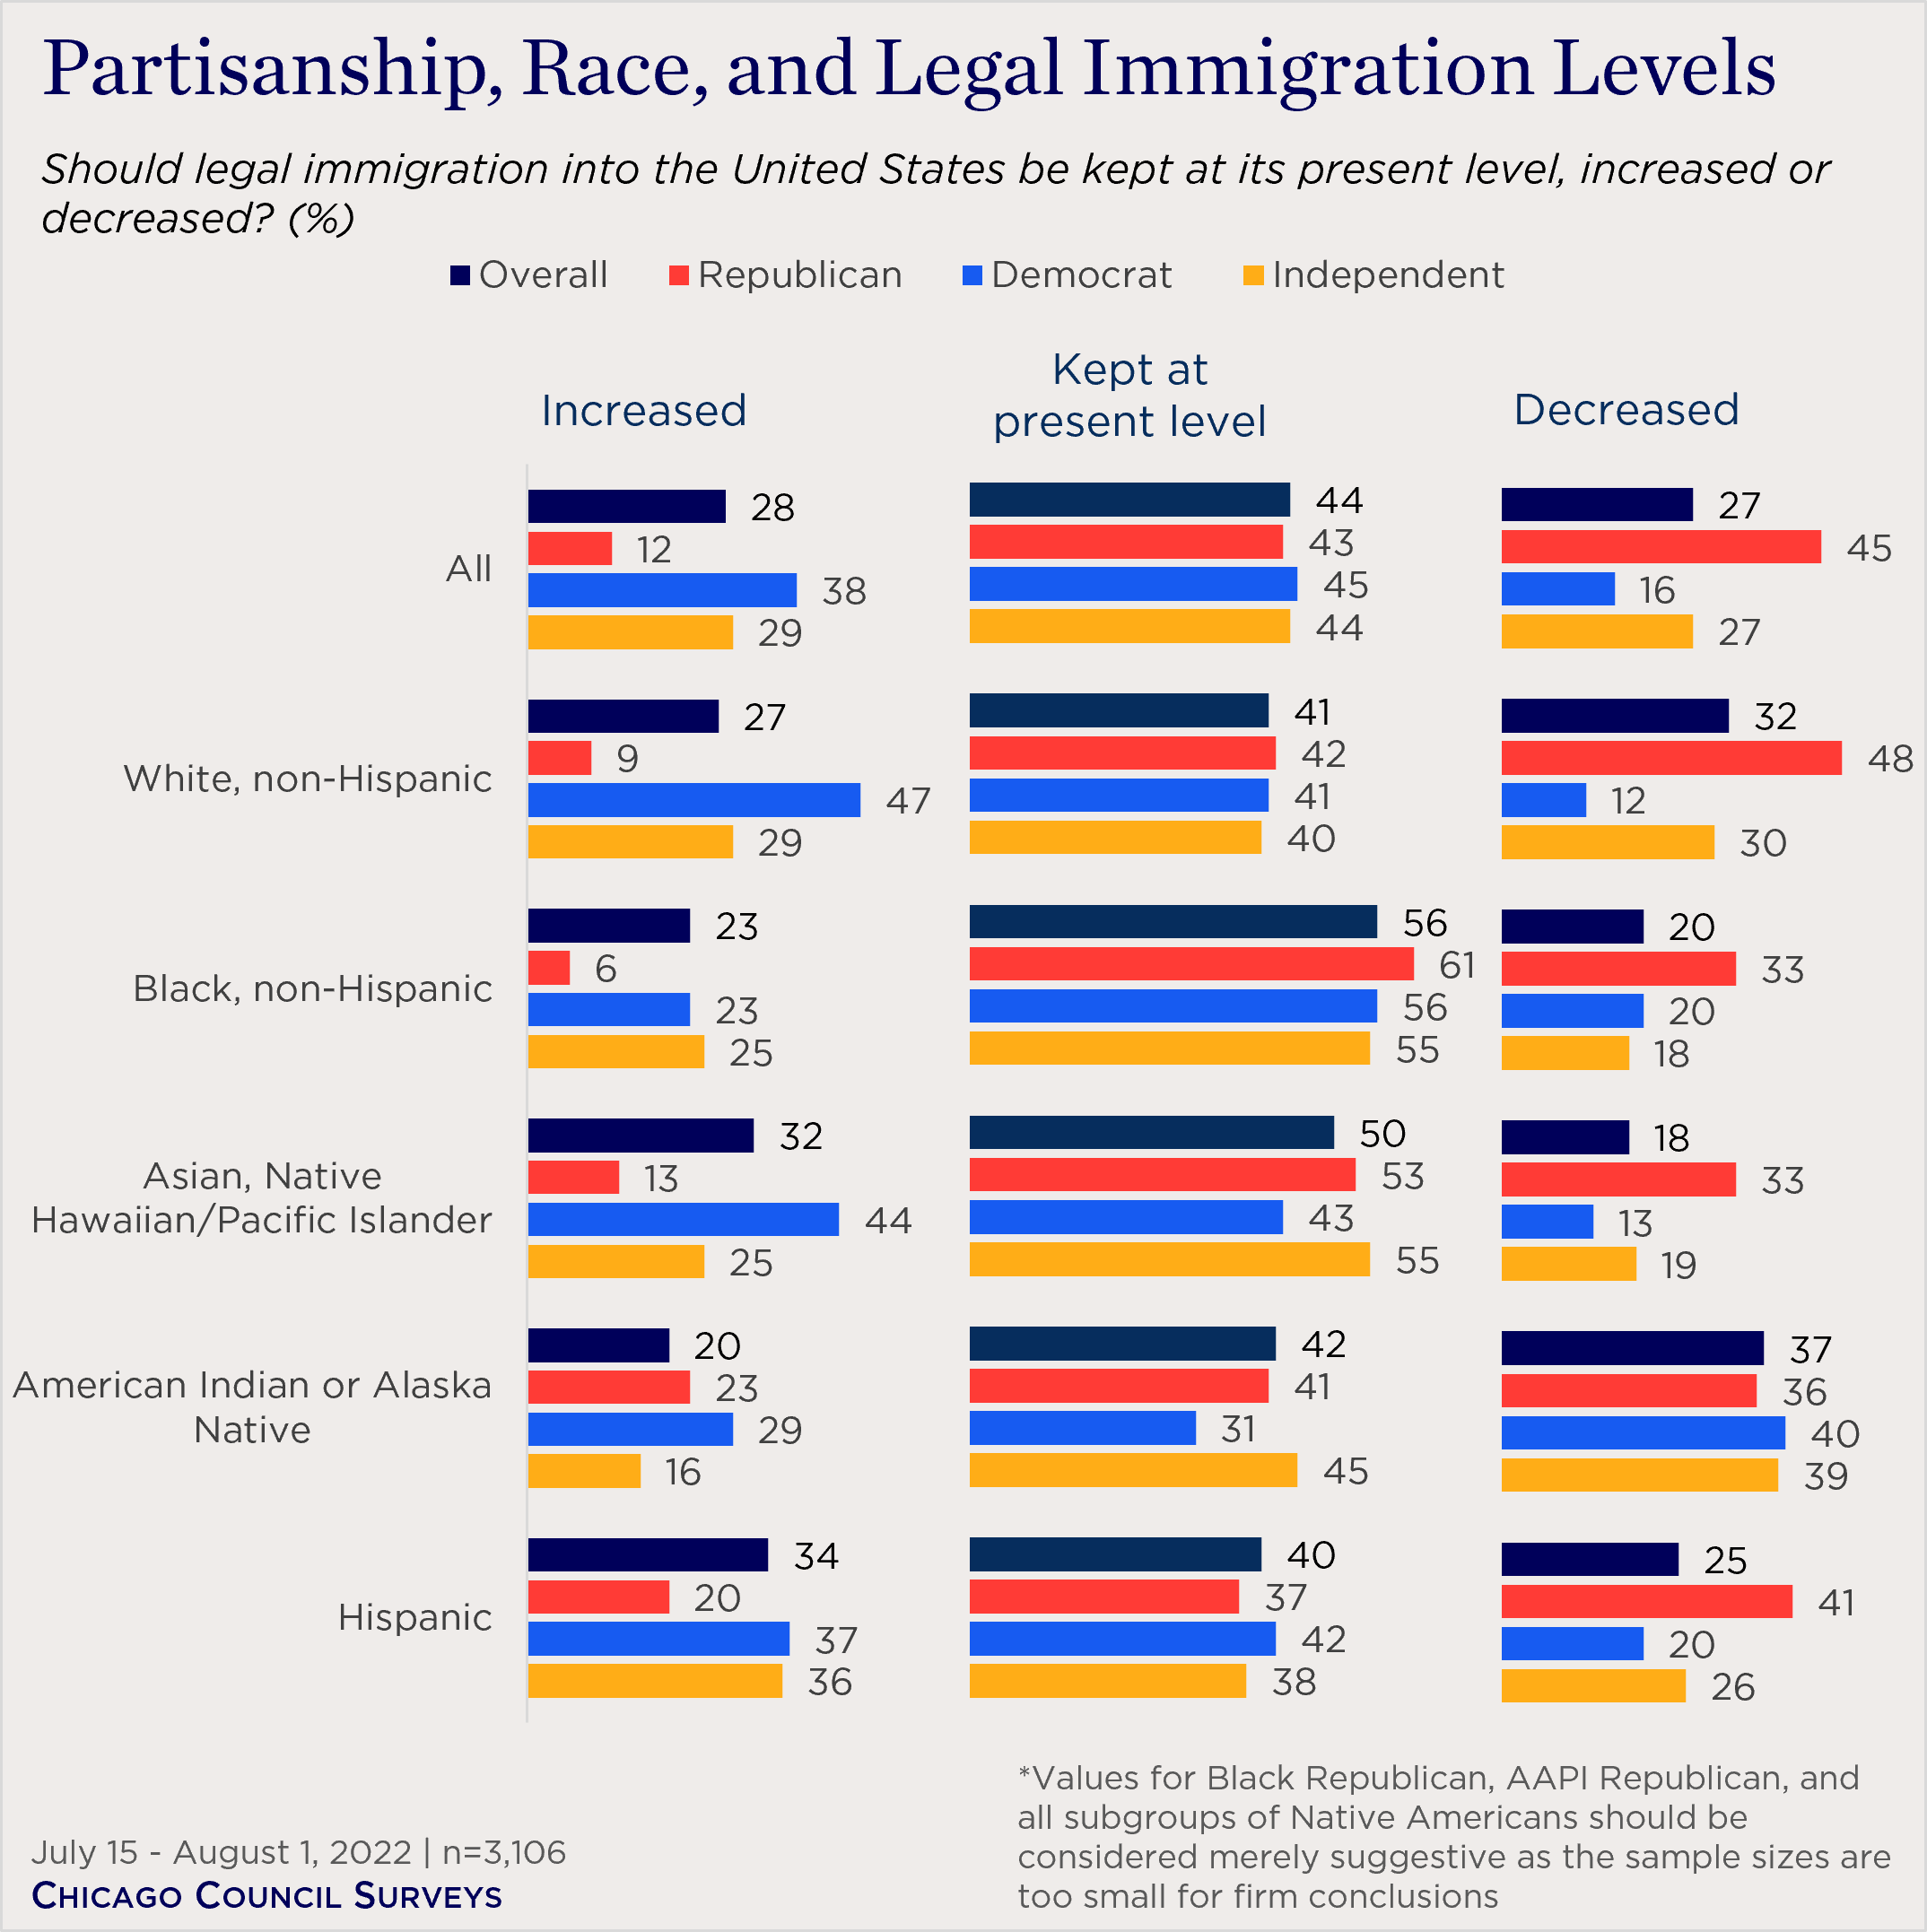
- Americans tend to say that legal immigration into the United States should be kept at present levels (43%, with 28% each saying it should either increase or decrease). Hispanic Americans (34%) are the most likely group to favor increased legal immigration to the United States, while a majority of African Americans (56%) and half of Asian Americans (50%) say it should remain at present levels.
- Partisanship is significantly associated with views on immigration and diversity across and within racial and ethnic groups.
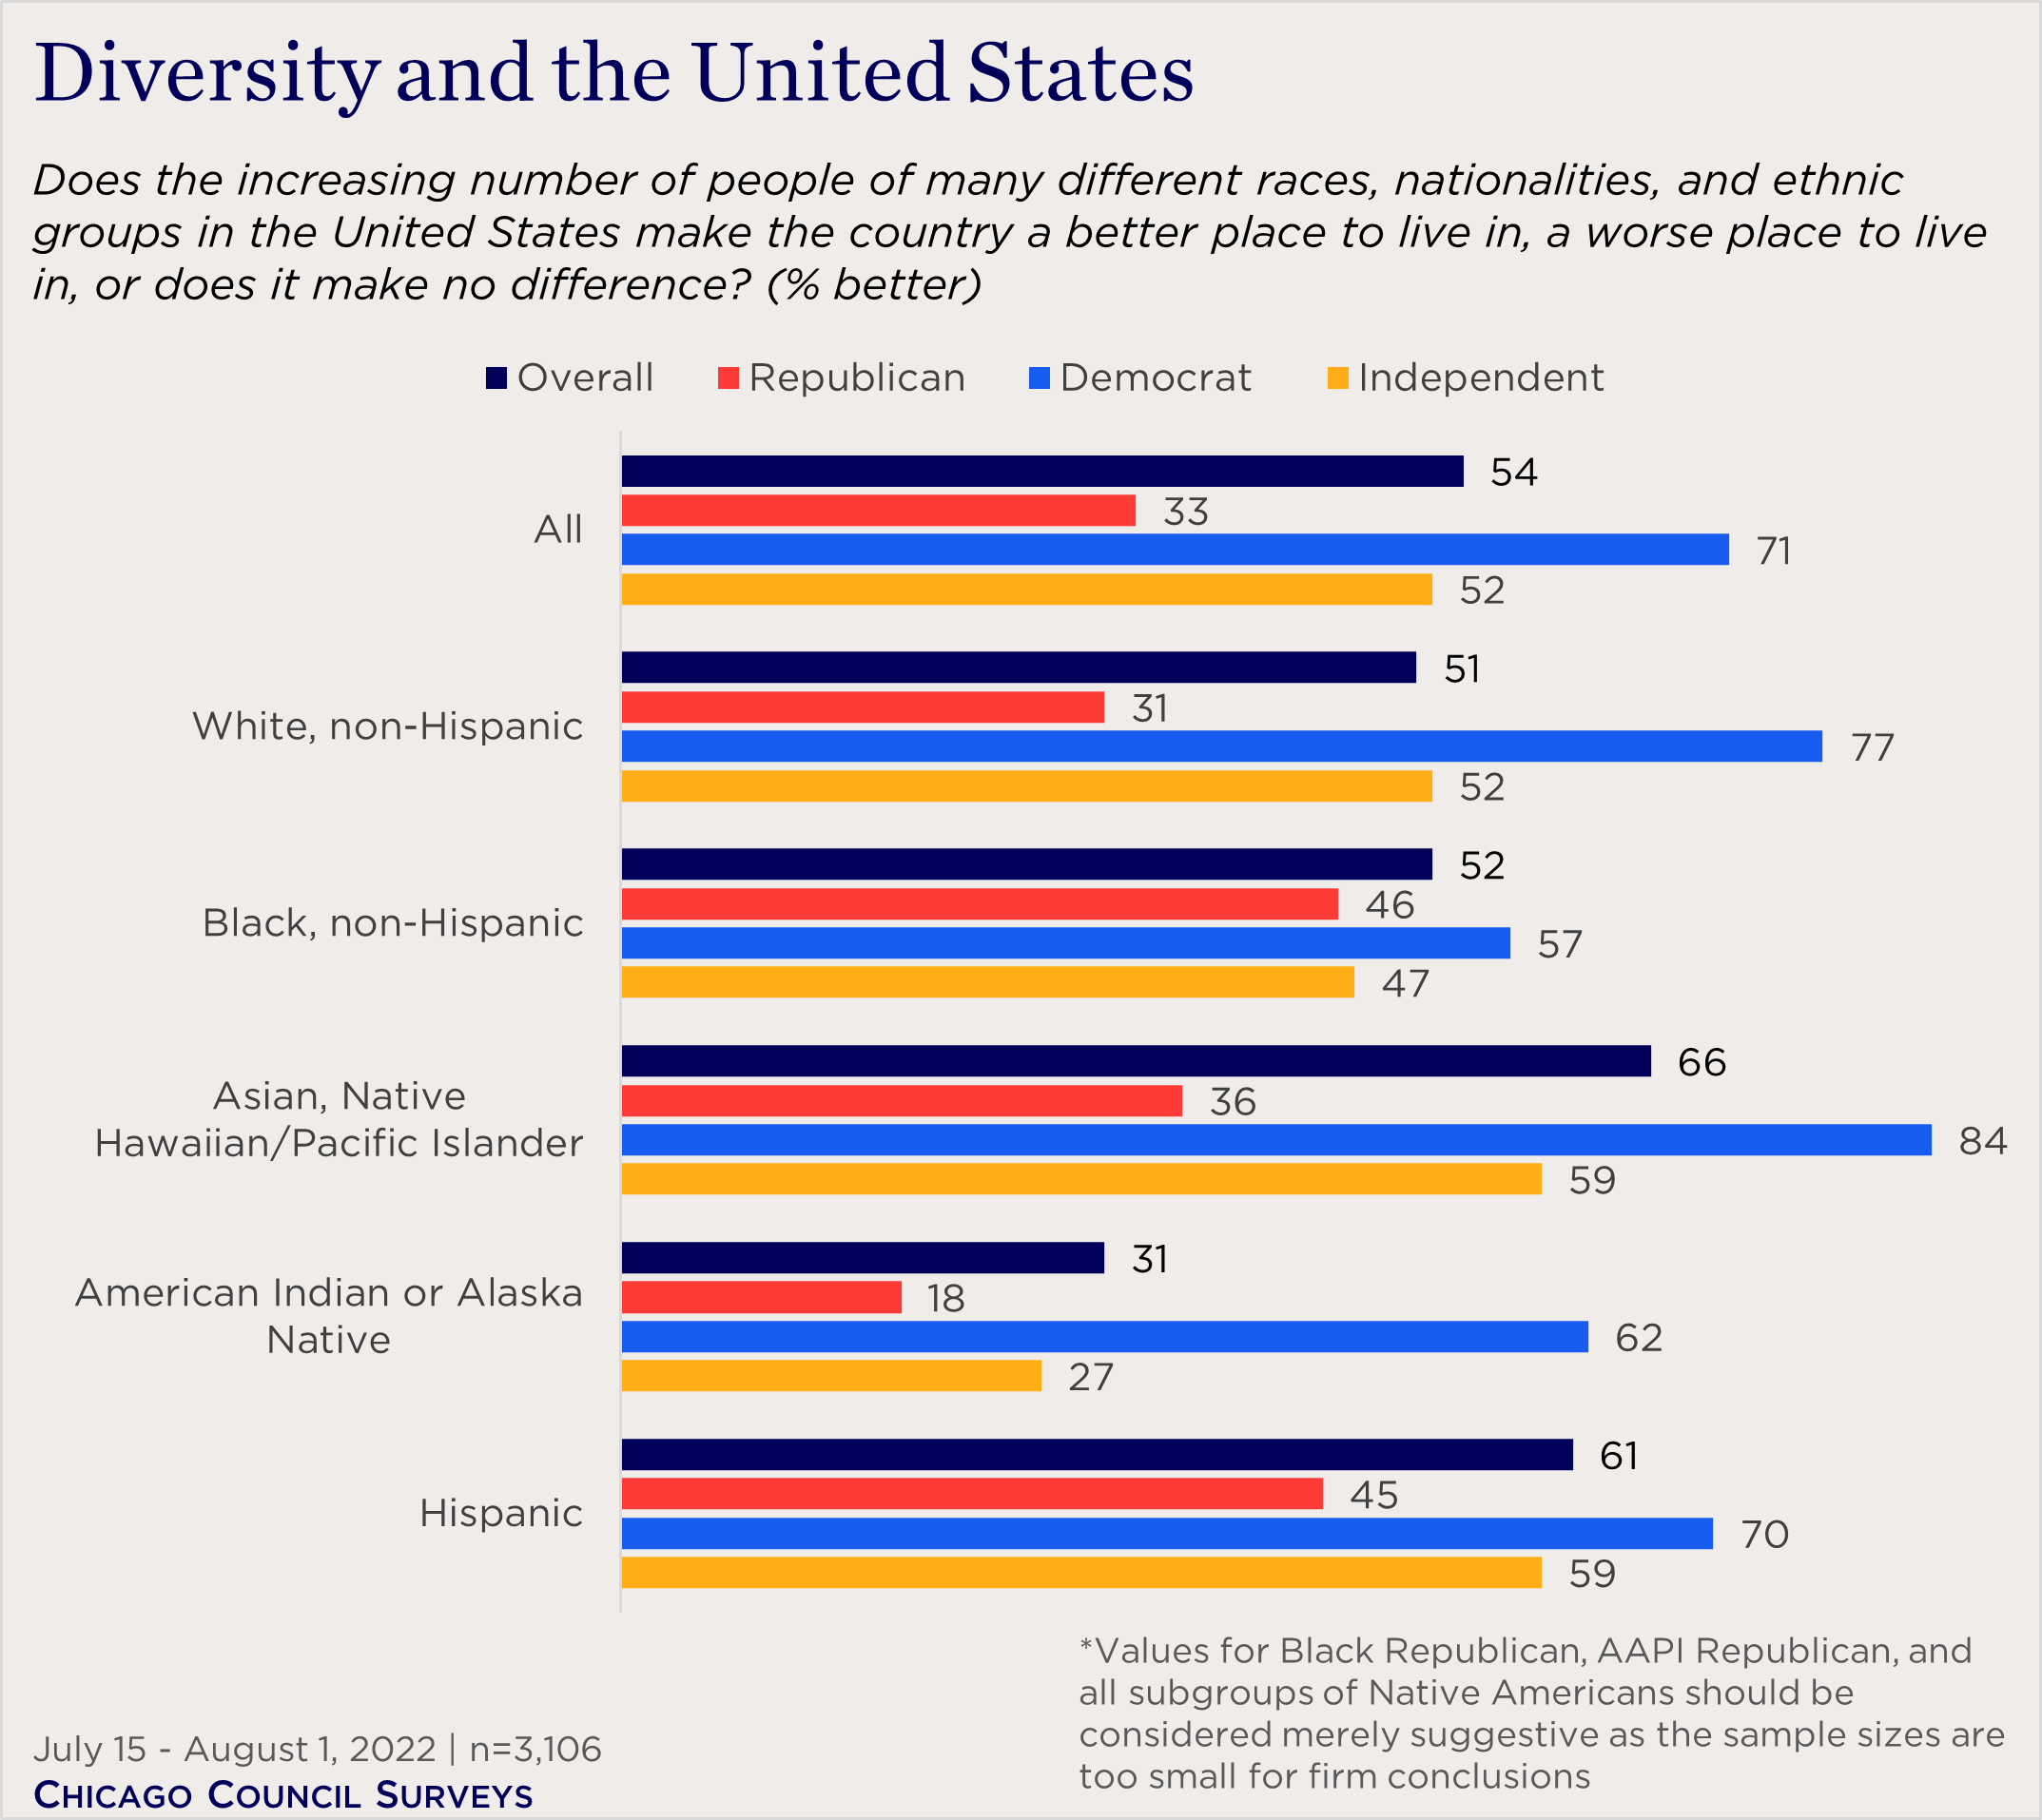
- Among those who self-identify as Democrats, Asian Americans (84%) and white Americans (77%) are the groups most likely to view increasing diversity as making the country a better place to live, while white Americans who self-identify as Republicans (31%) are the least likely to say so.
- The group most likely to support increasing legal immigration to the United States are white Democrats (47%), followed closely by Asian American Democrats (44%). Conversely, the group most likely to favor decreasing legal immigration levels are white Republicans (48%).
Positive Views of the Growing Diversity in the United States
In general, Americans have a positive view of a more diverse United States. A slight majority (53%) say that growing diversity makes the country a better place to live, and only 15 percent say it makes the country a worse place. Among racial and ethnic groups, Asian Americans are the most likely to see a more diverse country as a better country: 66 percent say so. They are closely followed by Hispanic Americans (61%). A narrow majority of Black Americans (52%) and half of white Americans (50%) agree. The group with the most negative views of increasing diversity: Native Americans, who are evenly divided in how they see it affecting the country (34% no difference, 33% worse, 30% better).
Across racial and ethnic groups, self-identified partisanship is importantly associated with perceptions of diversity and the United States. Among those who self-identify as Democrats, Asian Americans (84%) and white Americans (77%) are the groups most likely to view increasing diversity as making the country a better place to live, while white Americans who self-identify as Republicans (31%) are the least likely to say so.1
Partisanship is less associated with views of diversity among those who identify as Hispanic Americans and Black Americans than for other groups. Among Hispanic Americans, majorities of Democrats (70%) and Independents (59%) and a plurality of Republicans (45%) view increasing diversity as making the United States better. And while Black Democrats are more likely than other African Americans to view increasing diversity as making the country better, the differences are notably smaller than for other racial groups.
Racial, Partisan Divides over Levels of Legal Immigration
Immigration plays a significant role in the growing diversity of the United States. Across all groups, the prevailing view is that legal immigration to the United States should be kept at present levels (43% overall). A majority of African Americans (56%), half of Asian Americans (50%) and pluralities of Native Americans (42%), white Americans (41%), and Hispanic Americans (40%) agree. Hispanic Americans (34%) and Asian American and Pacific Islander (AAPI) Americans (32%) are the groups most likely to favor increased legal immigration to the United States, while Native Americans (37%) and white Americans (32%) are most likely to favor decreasing legal immigration.
Political affiliation is far more closely associated with Americans’ immigration policy preferences than is their racial or ethnic identification. However, when it comes to legal immigration, both race and partisanship have clear associations with Americans’ responses.
Partisanship is most clearly associated with immigration attitudes among white Americans. A plurality of white Democrats (47%) favor increasing legal immigration, while another four in 10 (41%) favor maintaining current levels. By contrast, a plurality of white Republicans (48%) favor decreasing legal immigration, with another four in 10 (42%) favoring keeping immigration levels as they are.
Black Americans provide a contrary example; a majority across the political spectrum favor maintaining legal immigration at present levels. That includes Black Democrats, who are the group of Democrats most likely to favor keeping immigration levels as they are (56%), and the least likely group of Democrats to support increased immigration (23%).
Asian Americans, too, show strong partisan divisions over legal immigration. AAPI Democrats are divided between increasing (44%) and maintaining (43%) immigration levels, while the data suggest that AAPI Republicans are more in favor of maintaining or decreasing legal immigration levels.
Hispanic Americans fall somewhere in the middle of this spectrum, with partisanship having notable but less severe association with immigration attitudes. A plurality of Hispanic American Democrats (42%) favor maintaining immigration at present levels, with over a third (37%) supporting an increase in immigration levels. Hispanic American Republicans are divided between decreasing (41%) and maintaining (37%) legal immigration levels.
Partisanship Dominates Views of Immigrants and Refugees as a Threat
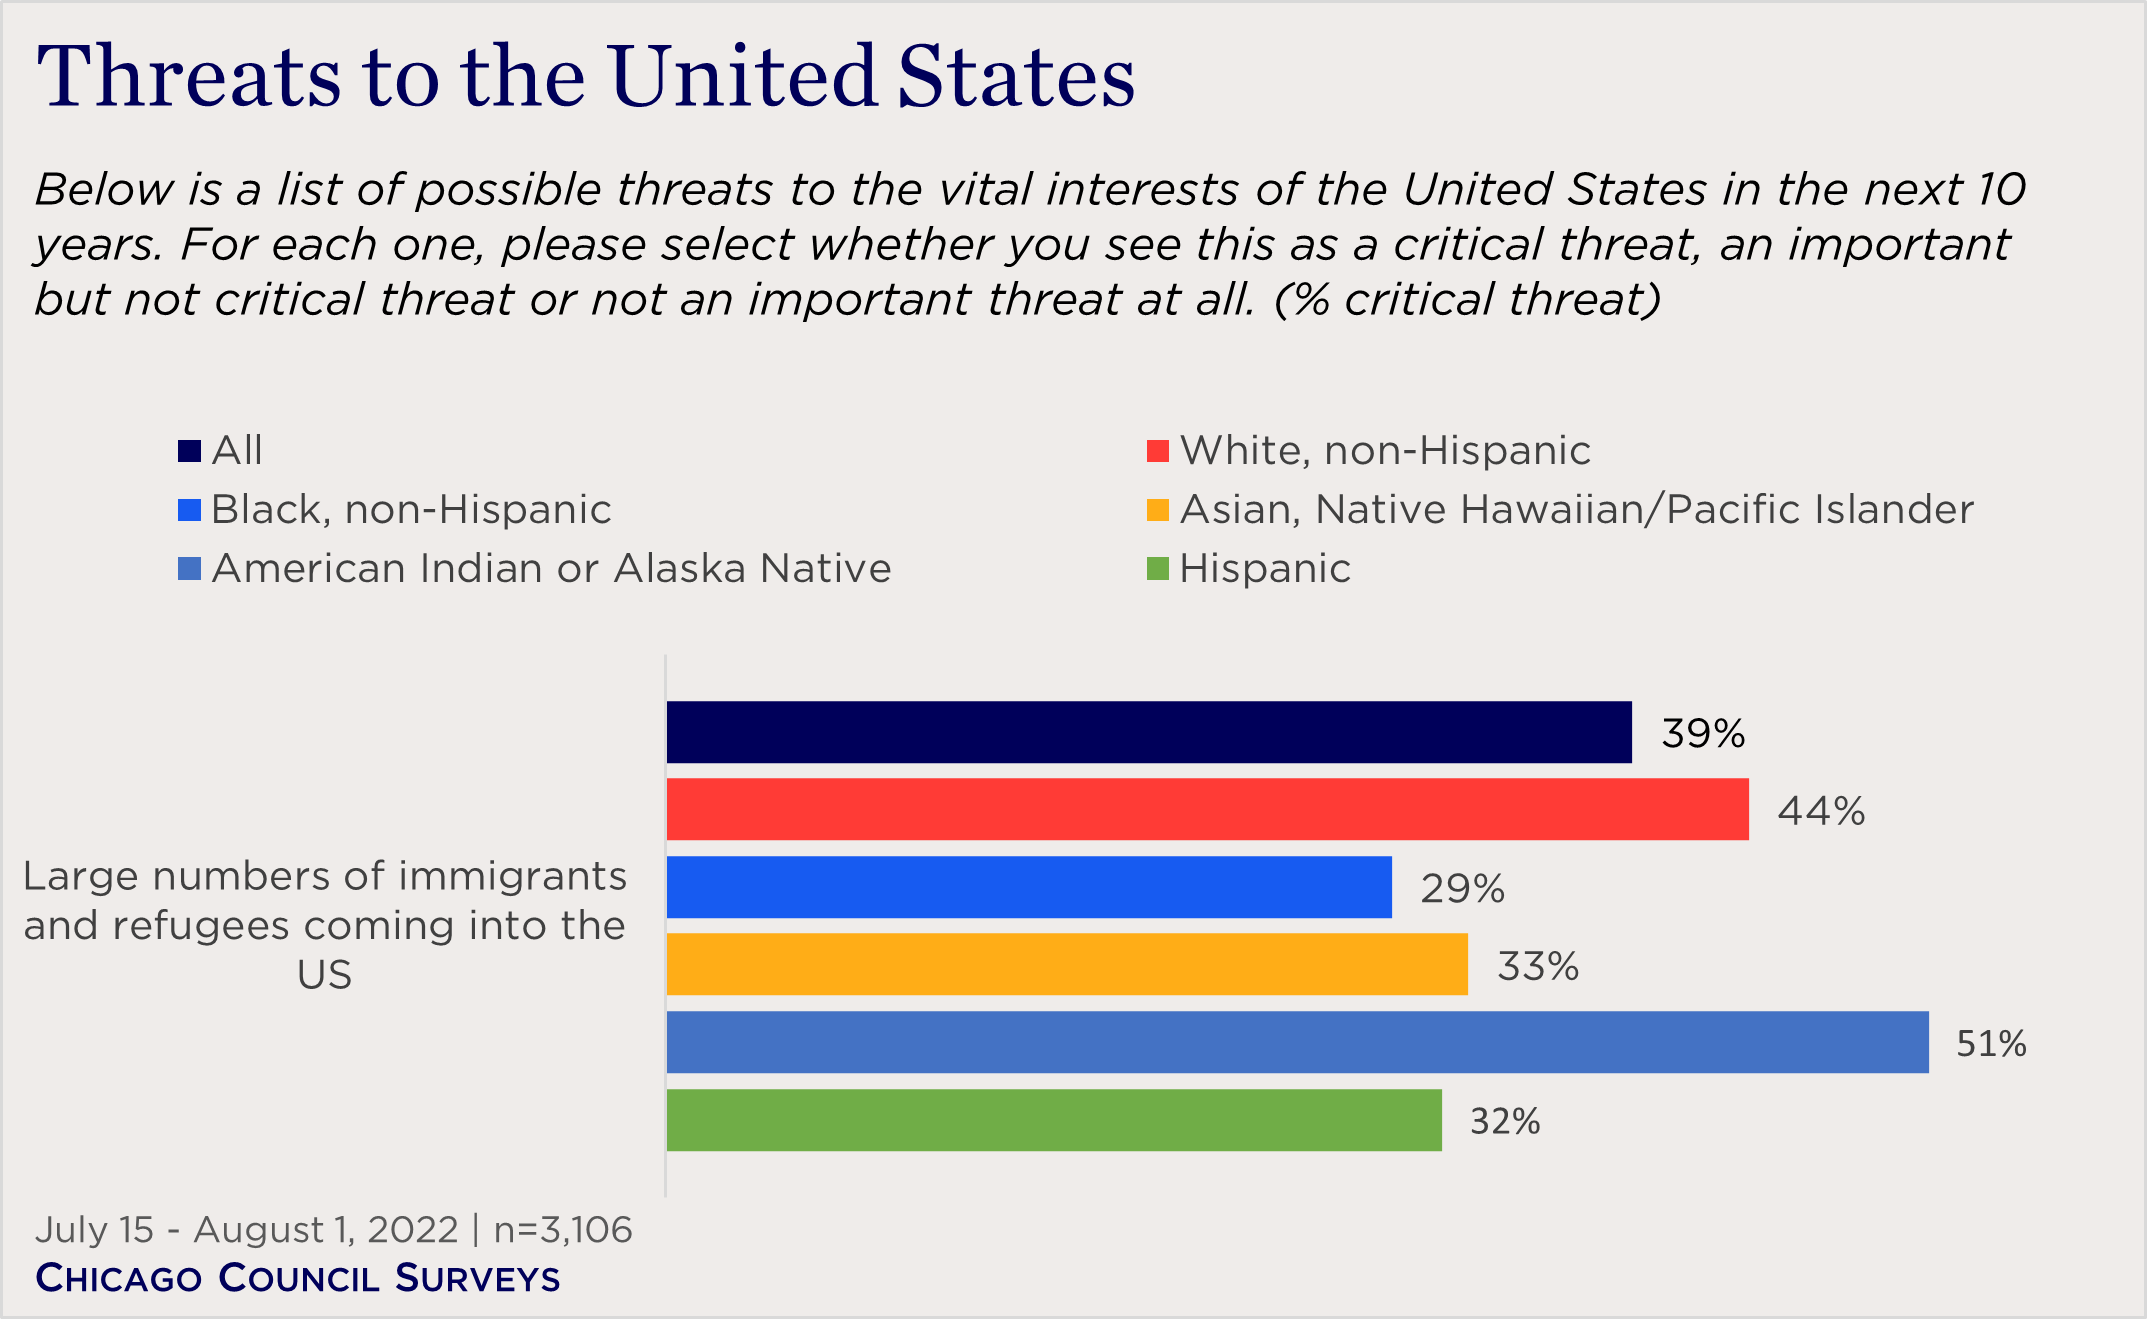
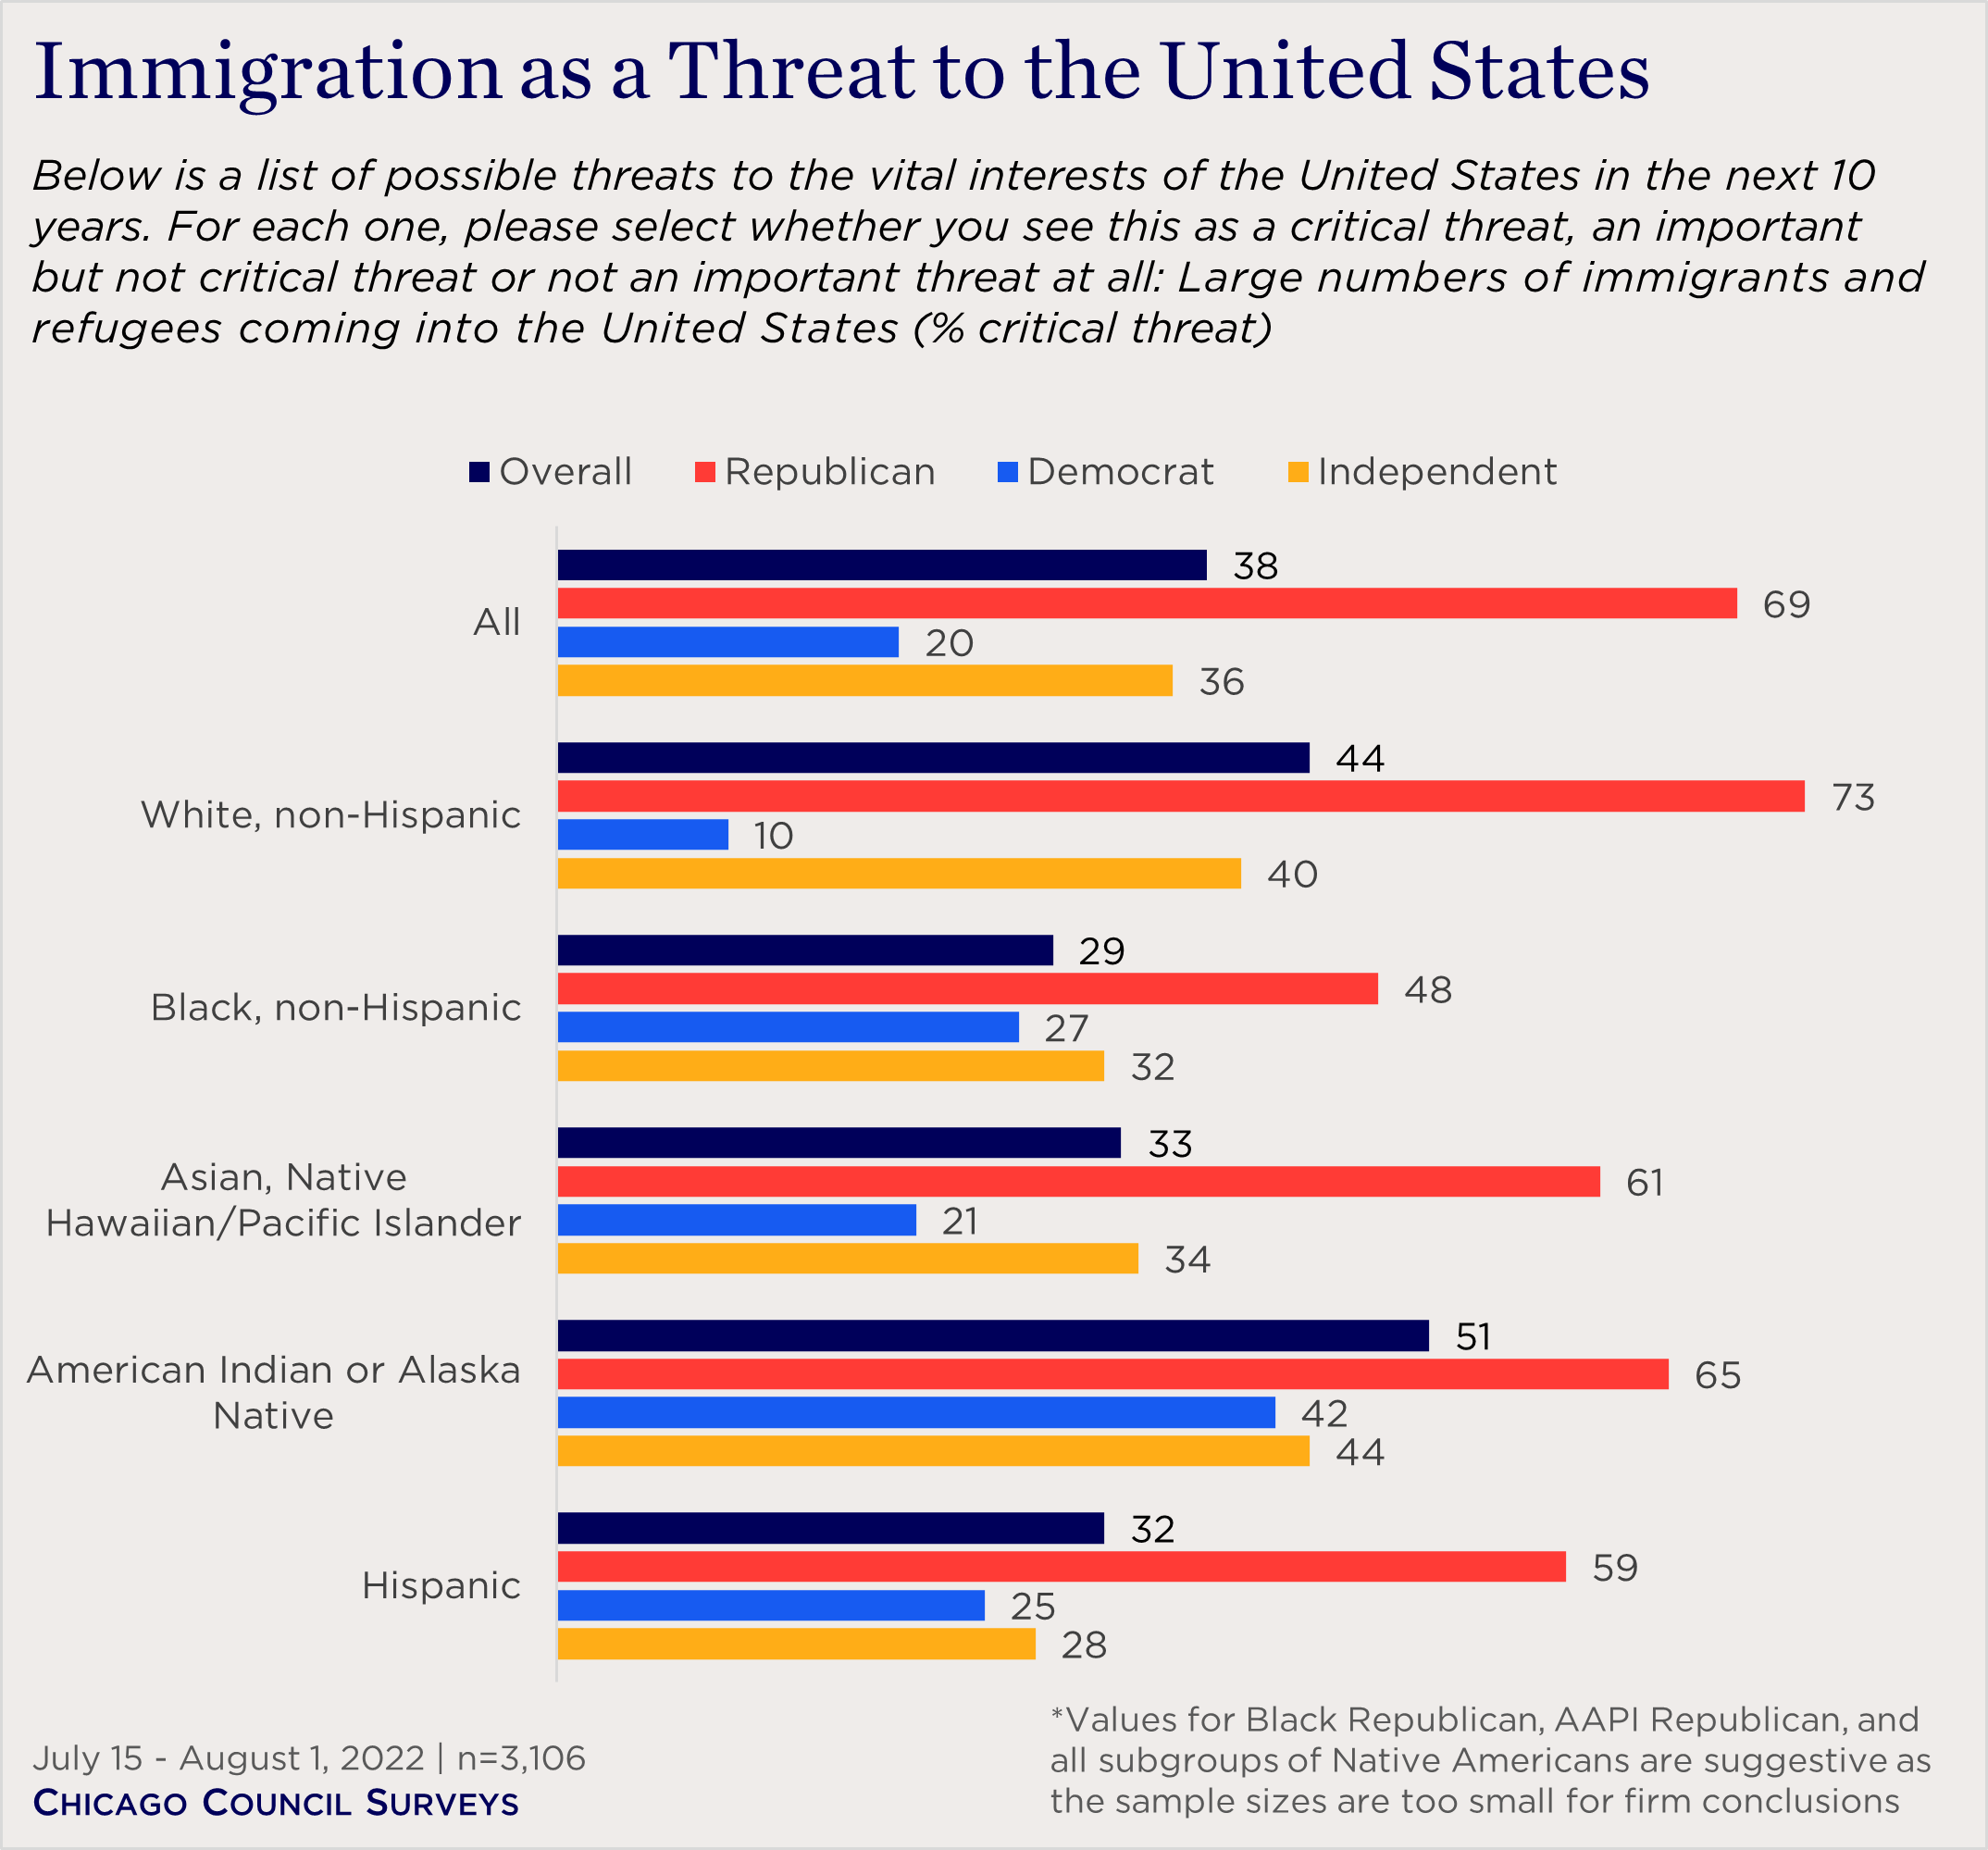
While Americans tend to think that legal immigration should be maintained, previous surveys show that Republican concern about undocumented immigration heightens their fears of immigrant inflows. Over the past two decades, the American public overall has become less likely to consider large numbers of immigrants and refugees coming into the United States a critical threat, and in this survey, four in 10 Americans (39%) consider an inflow of immigrants and refugees a critical threat. Matching their less enthusiastic views about immigration more generally, the group most likely to view this issue as a threat are Native Americans: half (51%) label it a critical threat. By contrast, a third or fewer of Asian Americans (33%), Hispanic Americans (32%), and Black Americans (29%) see immigration as a critical threat. White Americans fall in between these two groupings, with four in 10 (44%) naming immigration a critical threat.
However, the strongest predictor of concern over immigration is not race or ethnicity—it is partisan affiliation. Across all racial and ethnic subgroups, Republicans are consistently and substantially more likely than Democrats or Independents of the same race to consider a potential inflow of immigrants and refugees a critical threat to the country. This is especially true for white Americans. Three-quarters of white Republicans (73%), but only one in 10 white Democrats (10%), view immigration as a critical threat to the country. Hispanic Americans are similarly divided along party lines, though to a lesser degree. A majority of Hispanic American Republicans (59%) view the issue as a critical threat, while just a quarter (25%) of Hispanic American Democrats say the same. Data from the 2022 Chicago Council Survey suggests that the same division exists among Black and AAPI groups as well, though the sample contains a relatively small number of Republicans from either group due to their strong Democratic leanings.
Conclusion
While there are some differences by race on American attitudes toward diversity in the United States and support for immigration, partisan affiliation is a stronger factor in these attitudes. Across all racial and ethnic subgroups, Republicans are more threatened by immigrants and refugees than Democrats or Independents. These results prompt additional questions. What are the concerns and benefits that people from different groups attribute to immigration? And how do people from different groups see their political party affiliations interacting with their views on immigration? Future research is needed to help answer these questions.
- 1
While the reported value for Native American Republicans is lower, the sample size is quite small (n=28) and the margin of error is accordingly too large to take the results as more than suggestive of the partisan divisions among Native Americans.


This analysis is based on data from the 2022 Chicago Council Survey of the American public on foreign policy, a project of the Lester Crown Center on US Foreign Policy. The 2022 Chicago Council Survey was conducted July 15–August 1, 2022 by Ipsos using its large-scale nationwide online research panel, KnowledgePanel, in both English and Spanish among a weighted national sample of 3,106 adults aged 18 or older living in all 50 US states and the District of Columbia. The margin of sampling error for the full sample is +/- 1.8 percentage points. The margin of error is higher for partisan subgroups or for partial-sample items.
Partisan identification is based on how respondents answered a standard partisan self-identification question: “Generally speaking, do you think of yourself as a Republican, a Democrat, an Independent, or what?”
The 2022 Chicago Council Survey is made possible by the generous support of the Crown family and the Korea Foundation. With the support of New America Foundation, the survey also includes specific oversamples of Hispanic, Asian-American/Pacific Islander, Black, and Native American respondents. See the Appendix for more specifics on these sample group sizes and characteristics.
|
2022 Chicago Council Survey Demographics by Race/Ethnicity |
||||||
|
|
|
White, non-Hispanic (n=1534) |
Black, non-Hispanic (n=470) |
Asian, Native Hawaiian/ Pacific Islander (n=405) |
American Indian or Alaska Native (n=123) |
Hispanic (n=538) |
|
|
Average age |
51 |
46 |
46 |
50 |
43 |
|
Gender |
||||||
|
|
Female |
51 |
55 |
54 |
54 |
50 |
|
|
Male |
49 |
45 |
46 |
46 |
50 |
|
Education |
||||||
|
|
Less than high school |
6 |
9 |
4 |
18 |
25 |
|
|
High school |
27 |
35 |
16 |
19 |
33 |
|
|
Some college |
28 |
30 |
23 |
44 |
24 |
|
|
Bachelor's degree or higher |
39 |
26 |
57 |
20 |
18 |
|
Ideology |
||||||
|
|
Liberal |
26 |
35 |
36 |
18 |
32 |
|
|
Moderate |
33 |
44 |
38 |
41 |
39 |
|
|
Conservative |
40 |
18 |
25 |
35 |
28 |
|
Partisanship |
||||||
|
|
Republican |
35 |
6 |
17 |
28 |
17 |
|
|
Democratic |
25 |
61 |
46 |
21 |
44 |
|
|
Independent |
39 |
31 |
36 |
47 |
39 |

Related Content
 Migration
But American concern about large numbers of immigrants and refugees coming into the country has steadily decreased over the past decades.
 Migration
While half of Americans and a majority of Democrats say diversity makes the United States a better place to live, Republicans aren’t so sure.
 Migration
For the first time since the question was first asked by the Council in 1994, only a minority (40%) of Americans consider a large influx of immigrants and refugees a “critical threat” to the United States
 Public Opinion
Partisan divides on immigration issues are at their widest points. Democrats’ concerns have dropped dramatically, but Republicans continue to see it as a large threat.