A slim majority think Moscow should open up negotiations, but it is unclear what they might be willing to concede.
A just-completed November 24–30 Chicago Council-Levada Center survey in Russia finds that on the surface, a majority of Russians still support Russia’s “special military operation” in Ukraine. But a growing percentage of Russians are unsure of the reason for the invasion, and a sizable portion think Moscow should open up peace negotiations rather than continue fighting.
Key Findings
- Three-quarters of Russians actively or passively support the Russian military operation in Ukraine (74%).
- But an increasing percentage are unsure of the reasons behind the ongoing military action and what benefits it might bring to the country.
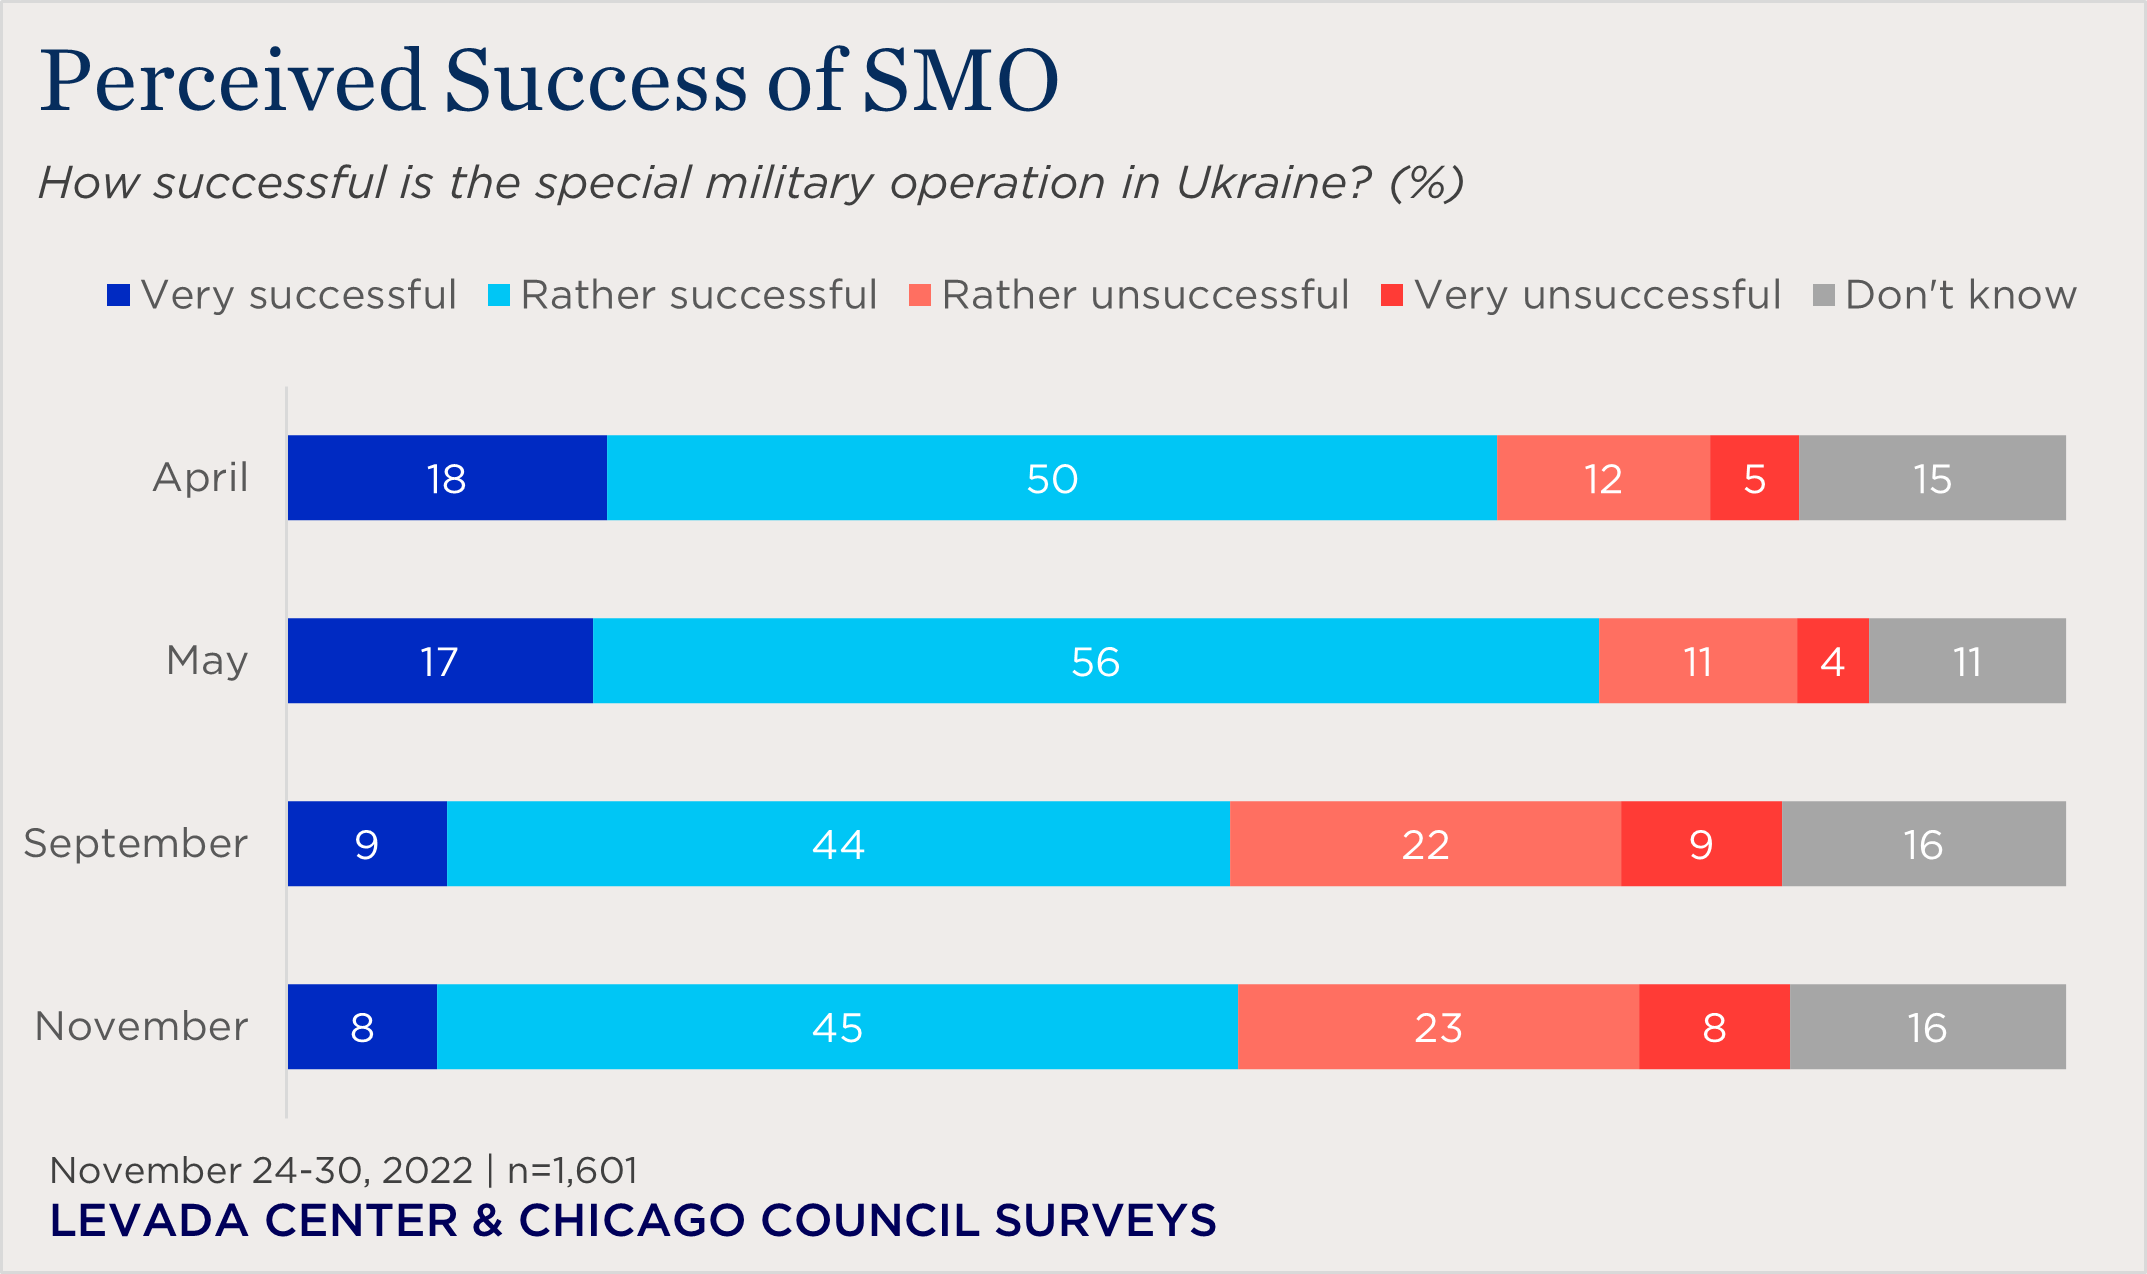
- A narrow majority of 53 percent of Russians think the operation in Ukraine has been successful, compared to 31 percent who say it has been unsuccessful.
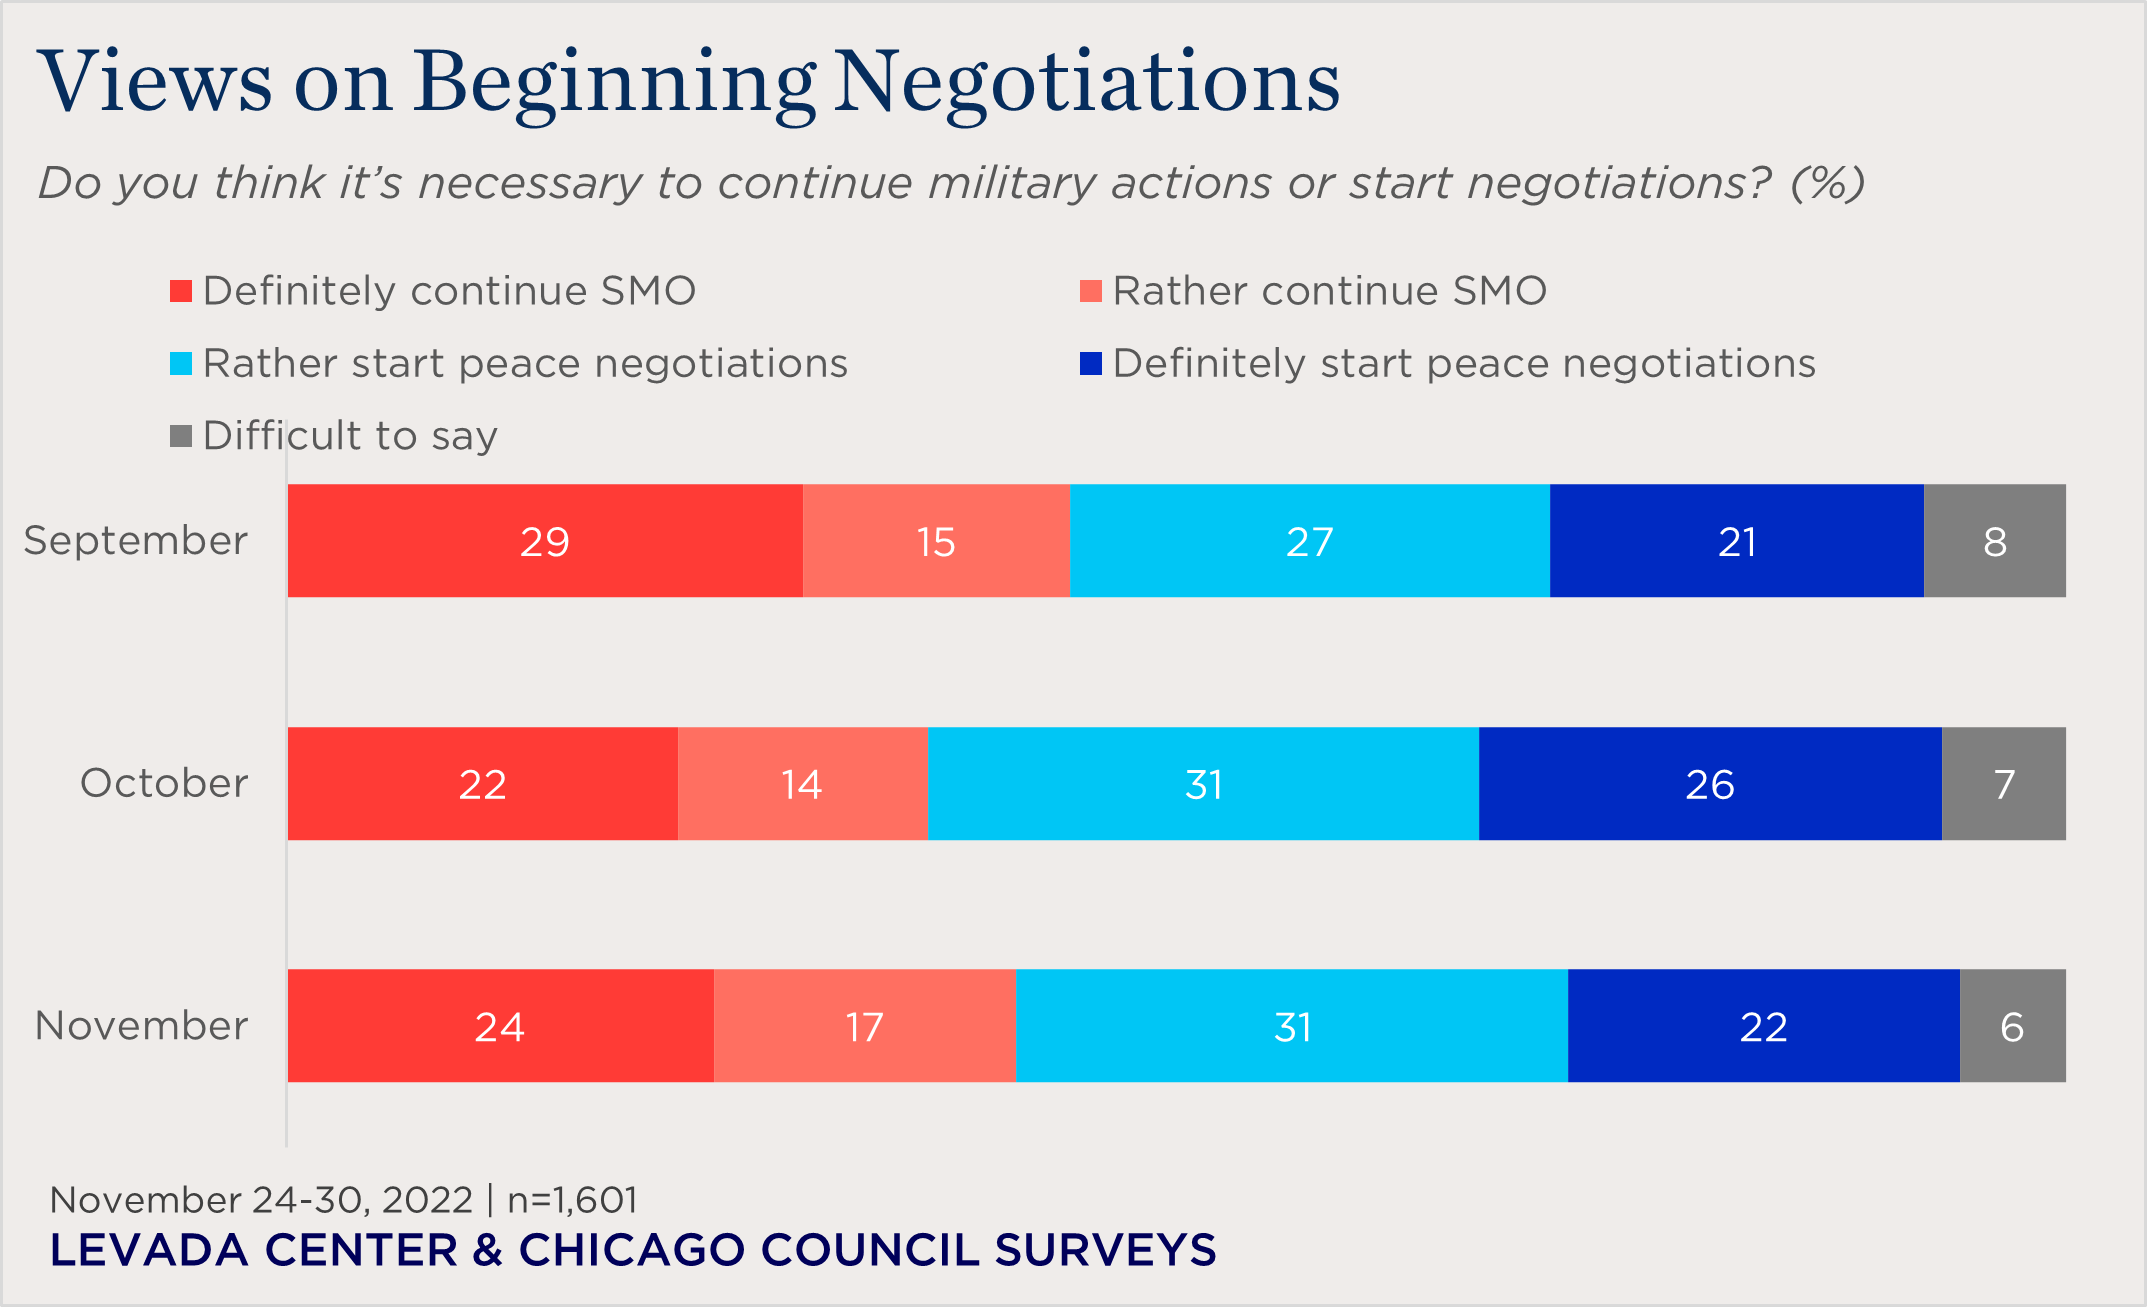
- By a 5 to 4 ratio, Russians think their government should start peace negotiations (53% vs. 41%) over continuing the special military operation.
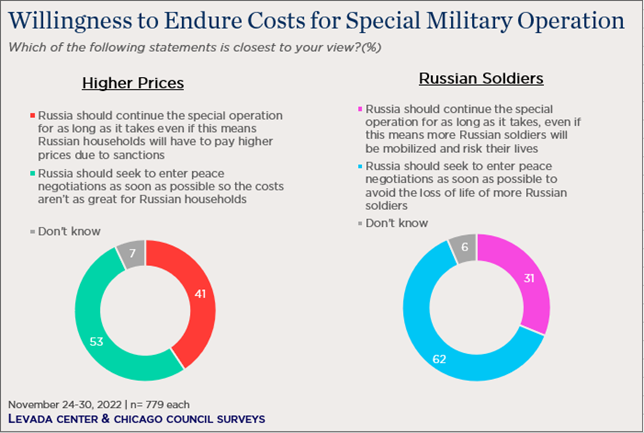
- When Russians are reminded of the costs associated with the war, they also express a preference for negotiations. Russians prefer peace negotiations over continued fighting that would bring the deaths of more Russian soldiers (62% vs. 31%) or higher prices for Russian households (53% vs. 41%).
- Despite some support for negotiations, the territorial concessions that Russia would likely be asked to make are unpopular. Solid majorities say it is unacceptable for Russia to return Crimea (78%) or the occupied Donbas region to Ukraine (66%).
Majority Continue to Support "Special Military Operation"
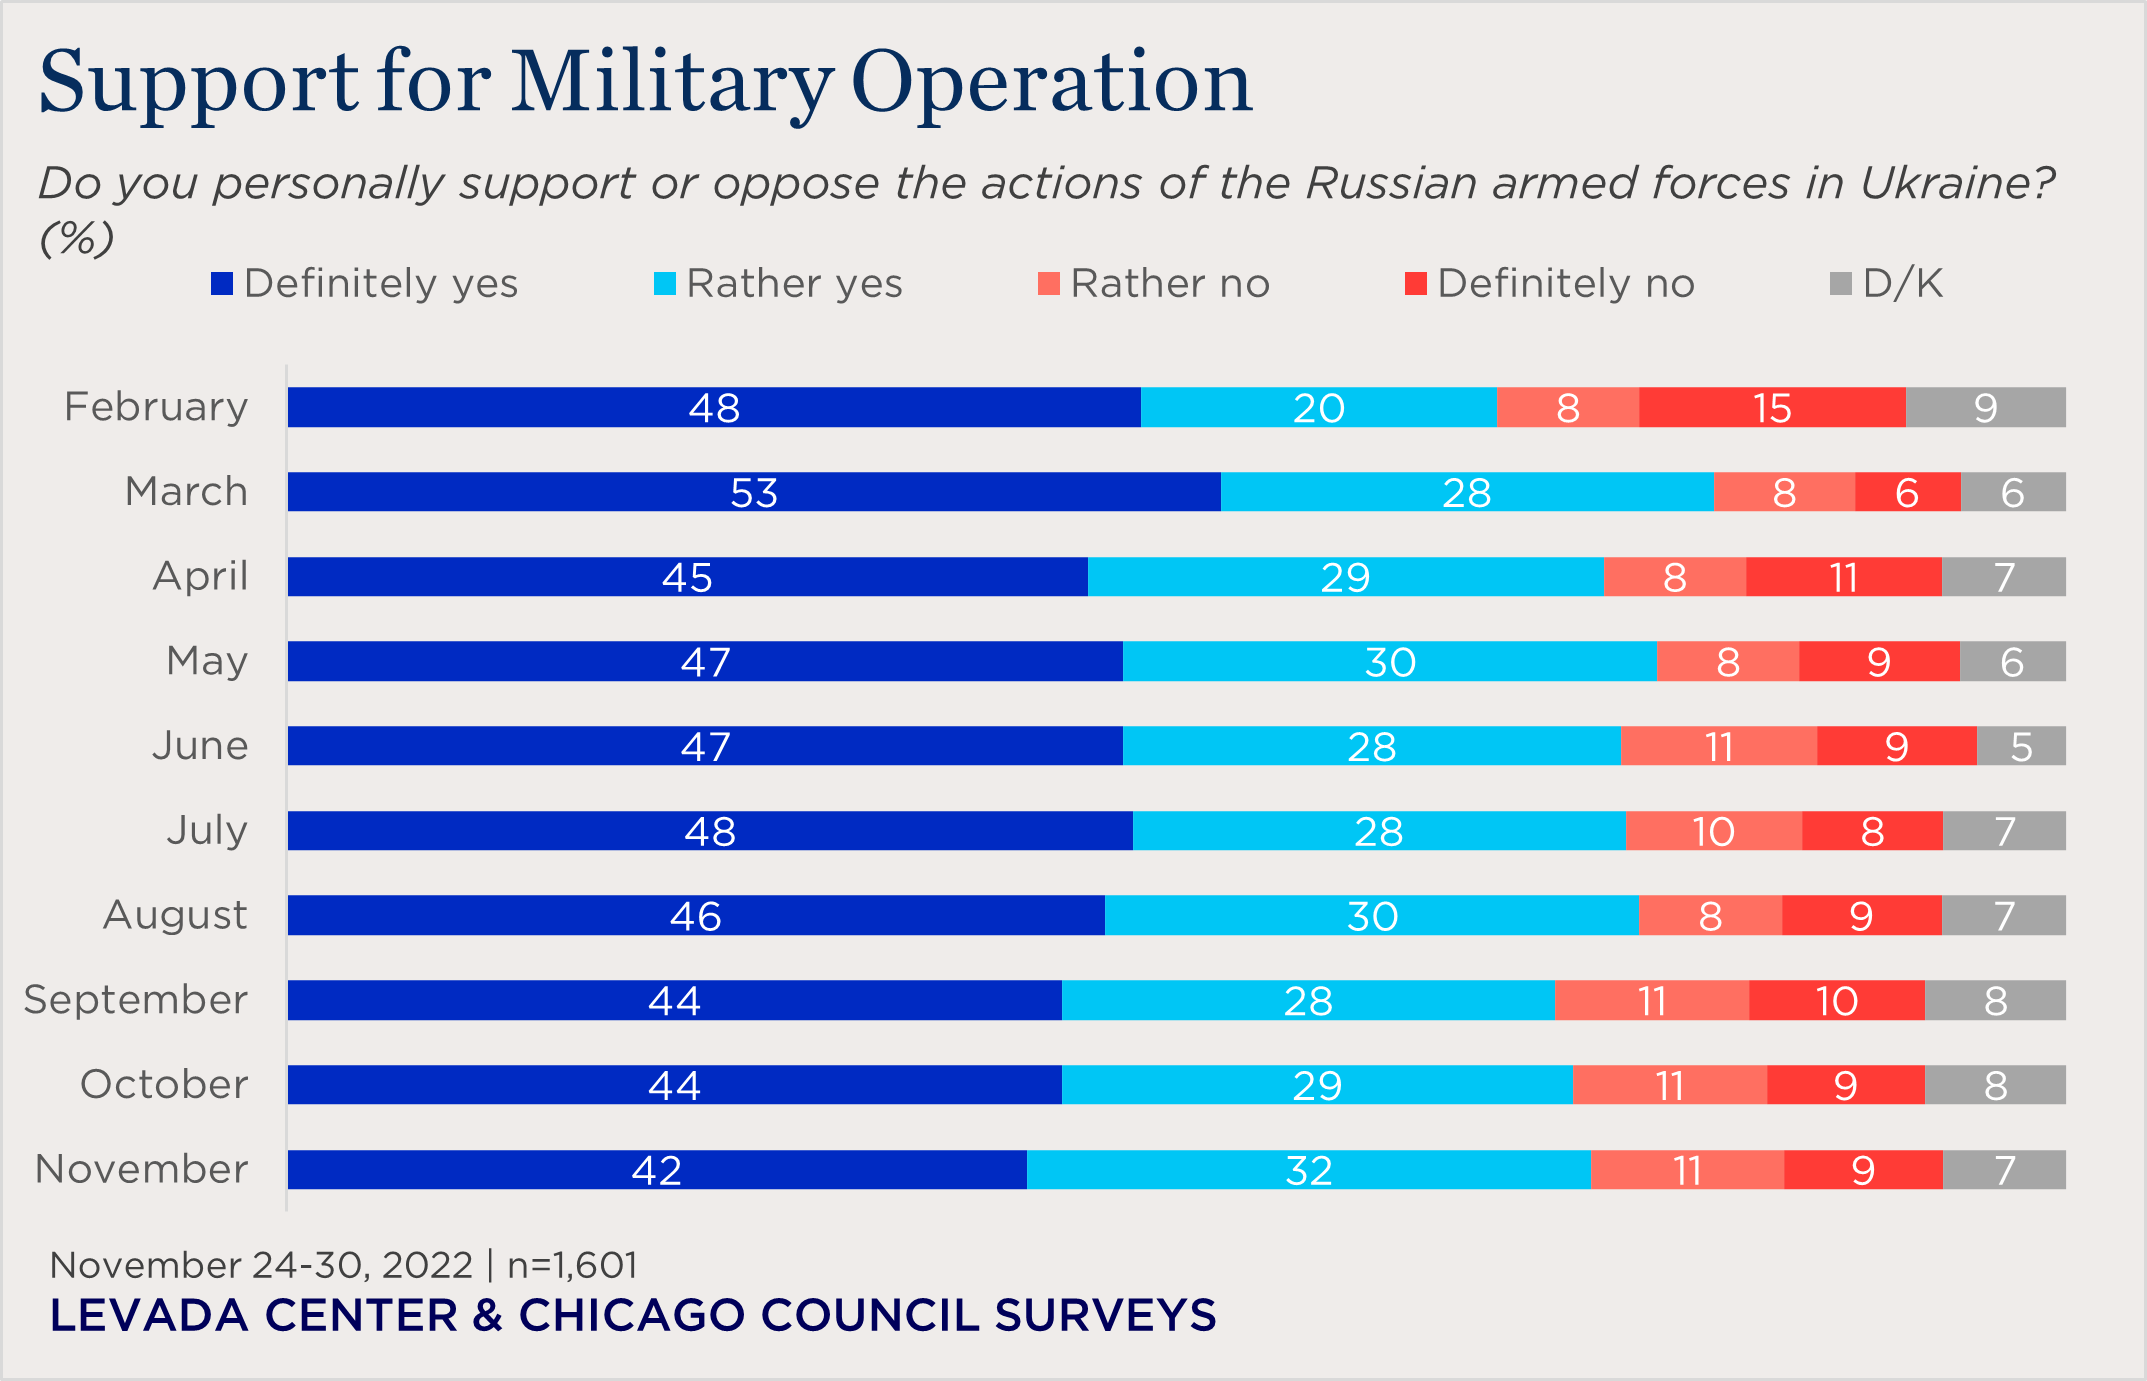
Four in 10 (42%) “definitely support” the actions of the Russian armed forces in Ukraine, and an additional 32 percent somewhat support it. These figures are broadly in line with polling conducted over the last few months, though strong support for the military operation1 has waned since it began (from 53% in March to 42% in November).
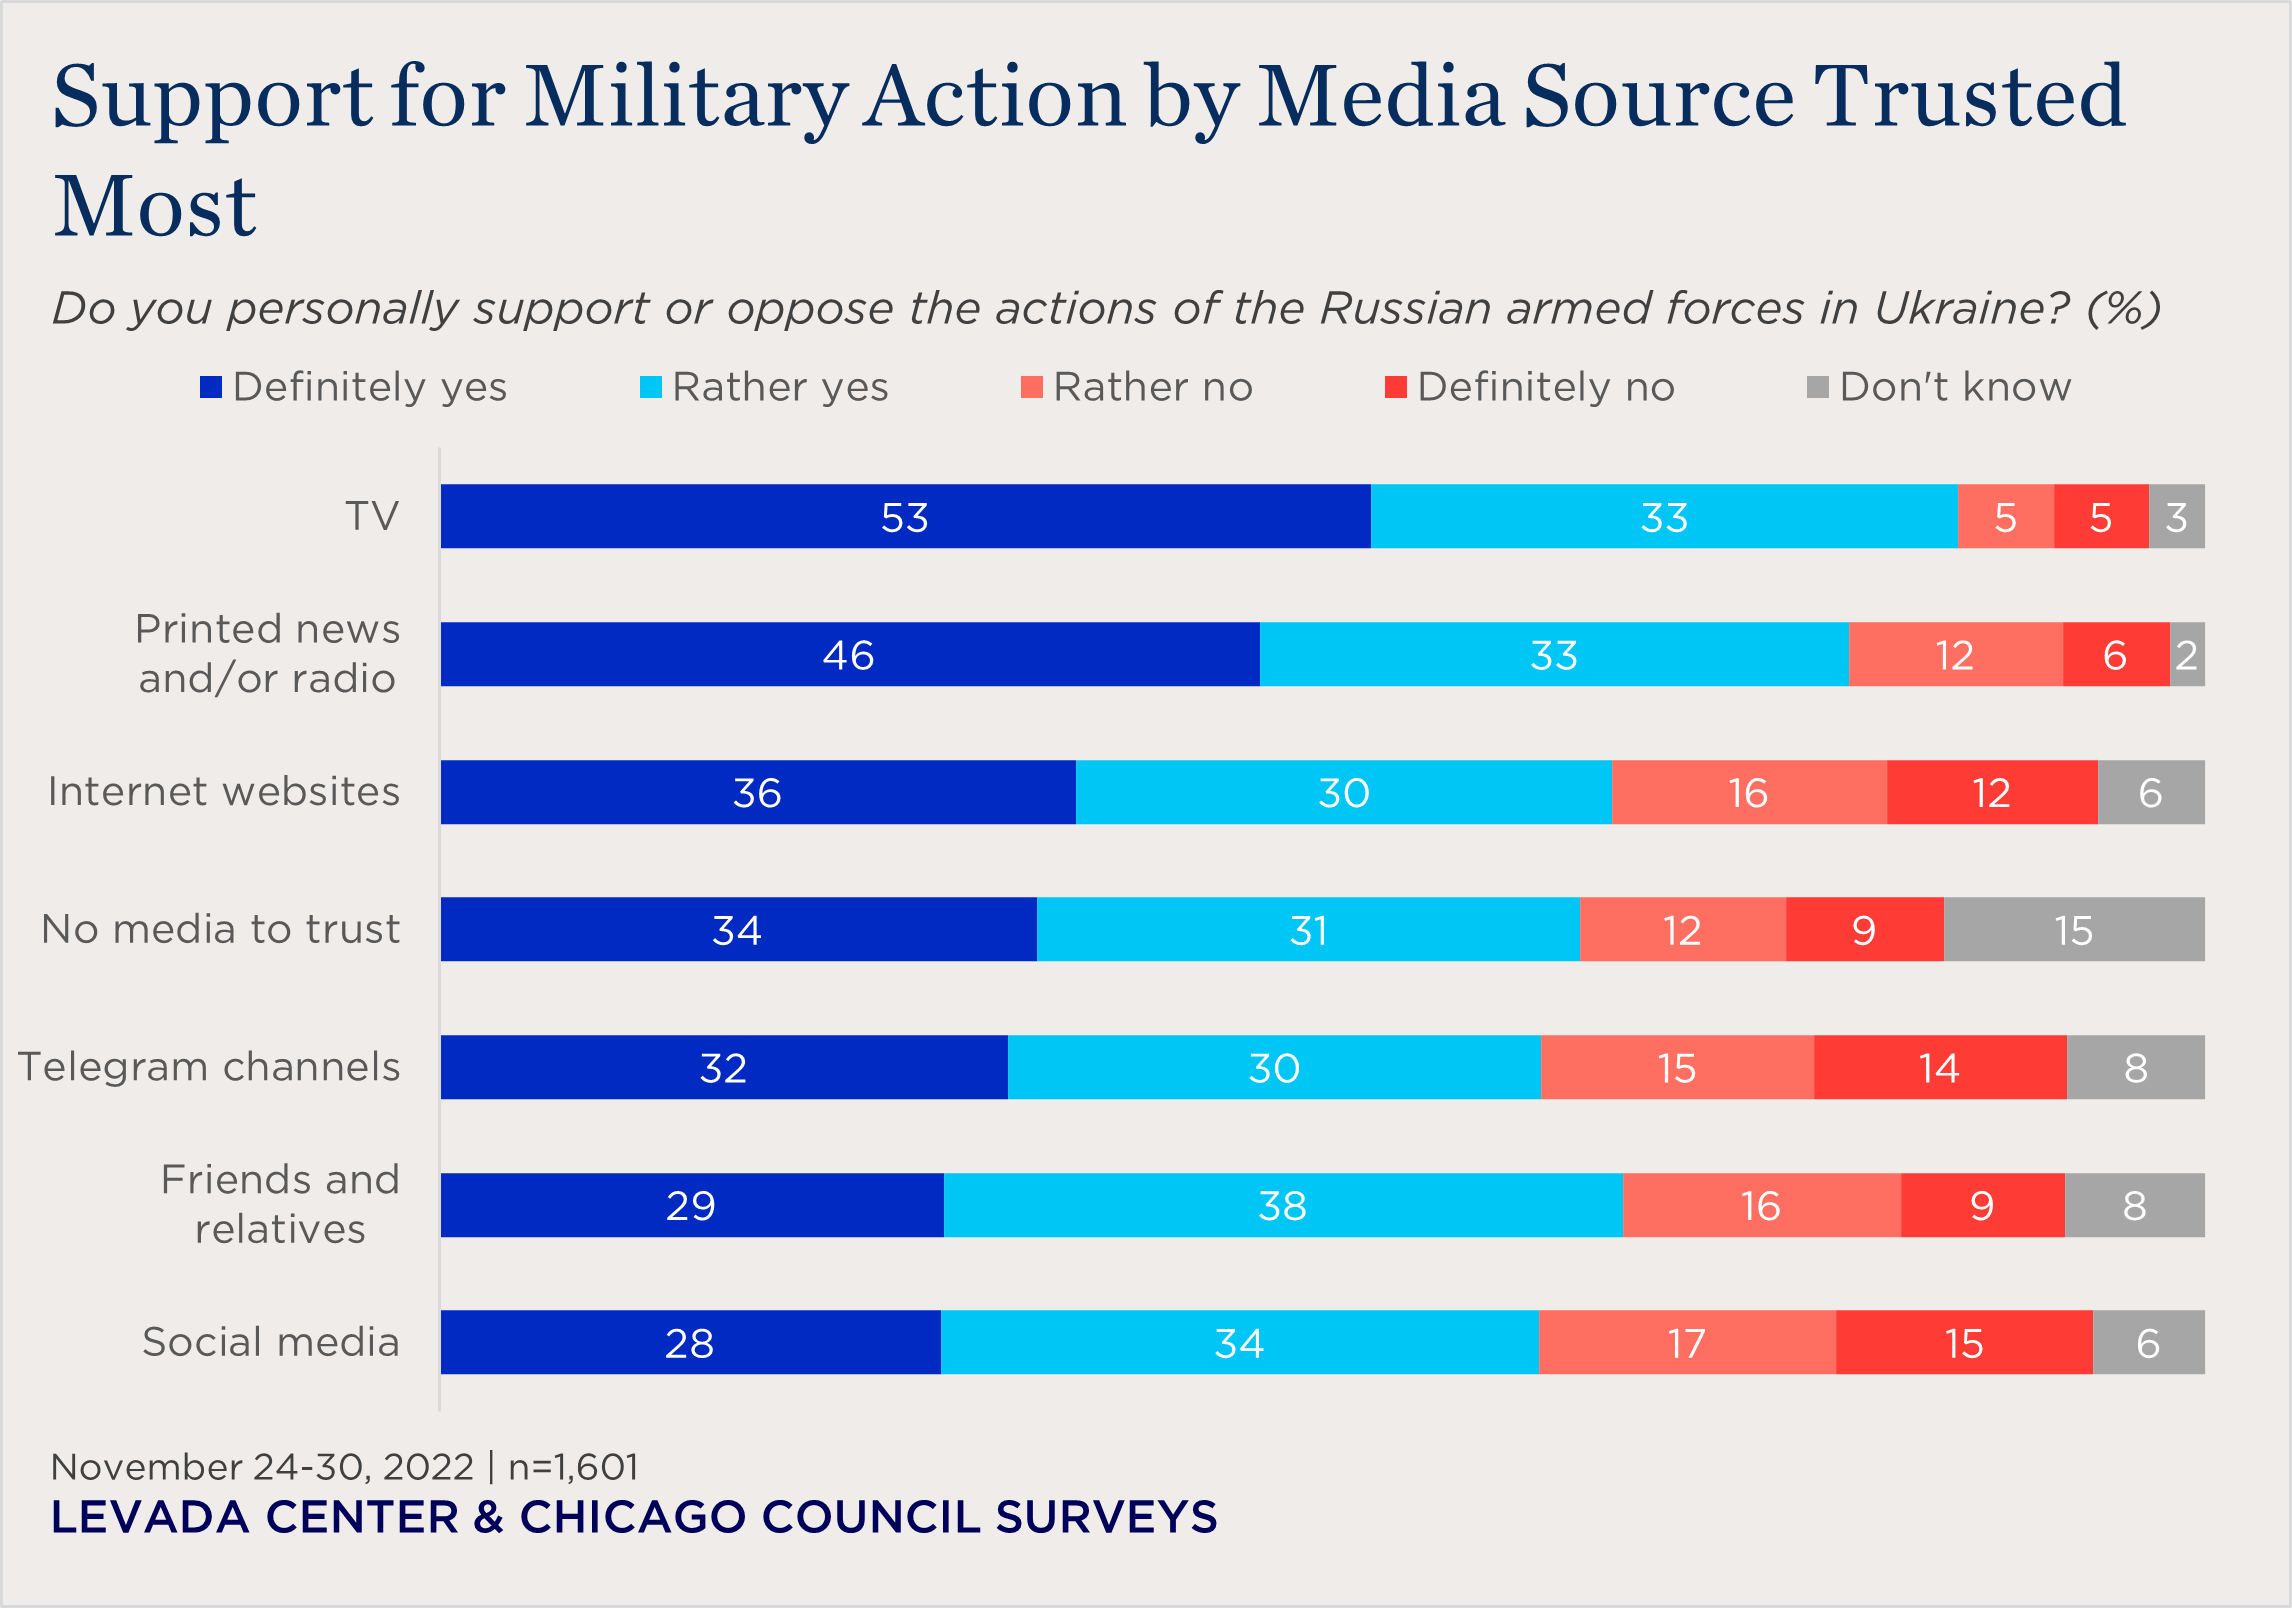
The Kremlin’s tight control over traditional media sources continues to influence Russian support toward the military operation, especially among those who most trust television news, major print sources, and the radio. Russians who trust these news sources are more likely to express strong support for the war than those who turn to more-independent outlets.2
A slim majority of those who trust television news (53%) and 45 percent each of those who trust printed news and radio strongly back the military operation. Strong support is lower among those who trust internet news sites and significantly lower among those who trust Telegram channels, friends and relatives, and social media.
Another way that people in Russia seek to access independent media is through virtual private networks (VPNs). Asked in a separate question from the other media sources, only 27 percent of the public overall uses a VPN. Those who use a VPN to access the internet are significantly less likely to express strong support for the military operation (28%) than those who use the internet without a VPN (46% strong support), or those who do not use the internet at all (49% strong support). This correlation is consistent with data from the Council-Levada March 2022 survey, which also found lower support for the conflict among independent media users.
Pride Versus Anxiety
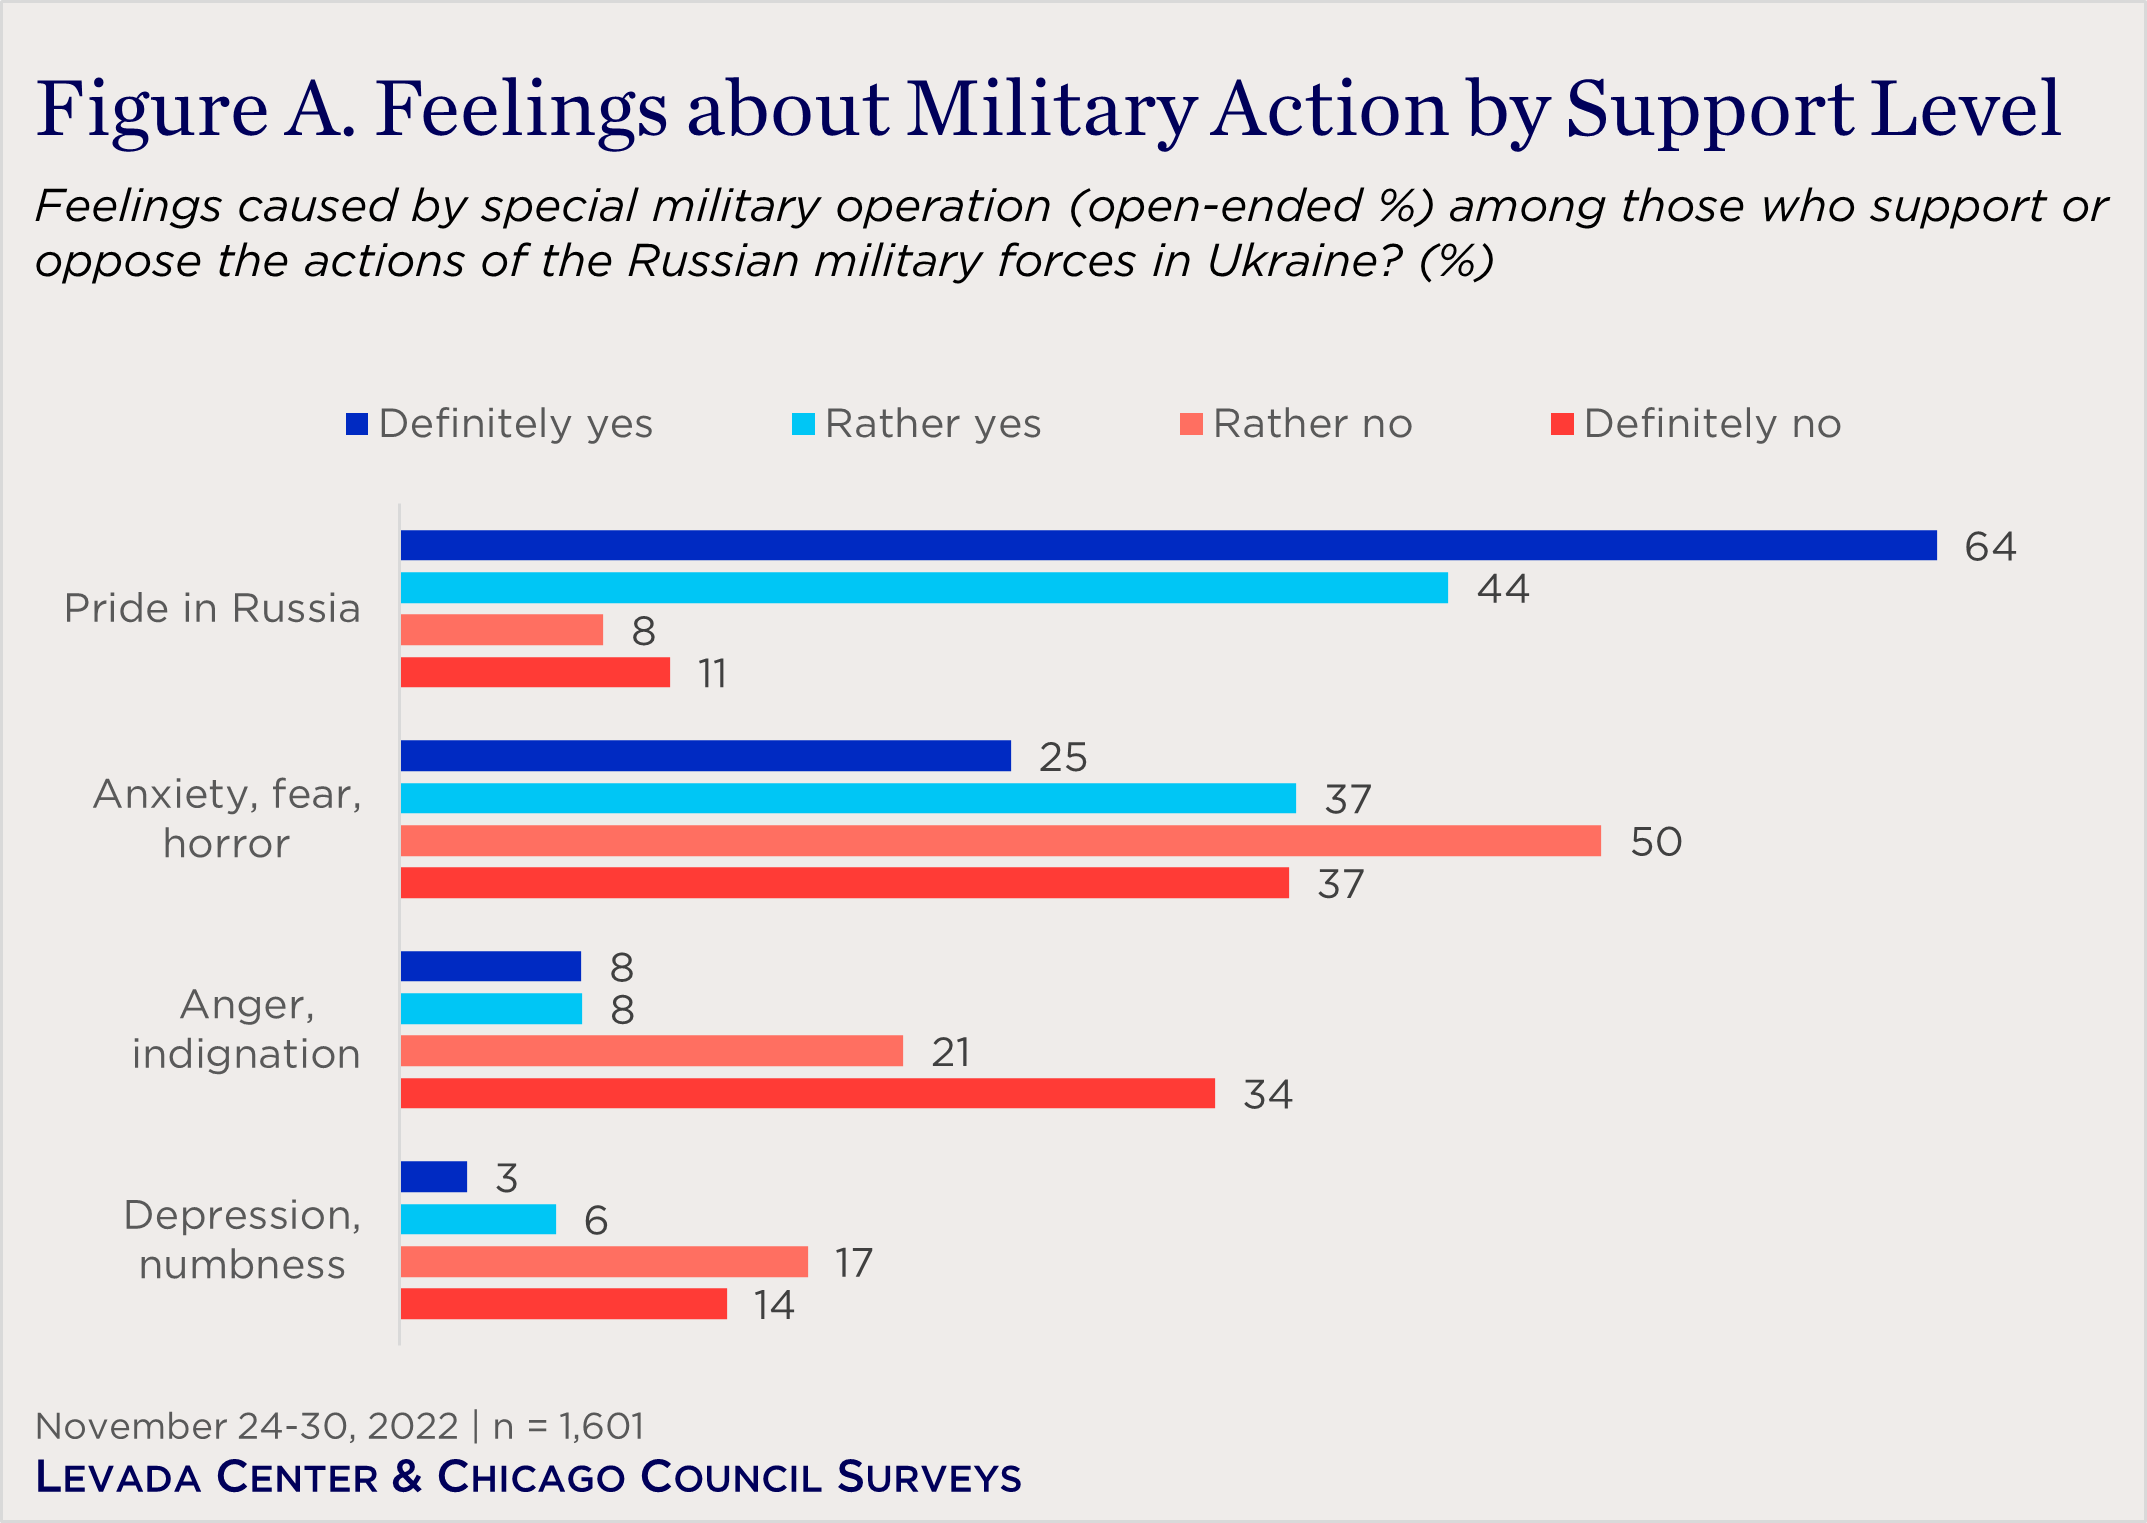
Different emotions are attached to the strong supporters (“definitely yes”) versus the more passive supporters (“rather yes”) of the war. Strong supporters are more likely to express pride when reflecting on the military action (64% vs. 44% passive supporters). Passive supporters are more divided between those who express pride (44%) and those who express anxiety, horror, or fear (37% of passive supporters vs. 25% of strong supporters). (Appendix Figure A)
Increasing Percentage Unsure about Operation Objectives
When asked in an open-ended question what the primary reason is for the Russian military operation, the relative rankings are largely unchanged from last March. But a larger percentage now (15%) than in March (9%) responded that it is “difficult to say” or that they don’t know the main purpose of the operation.
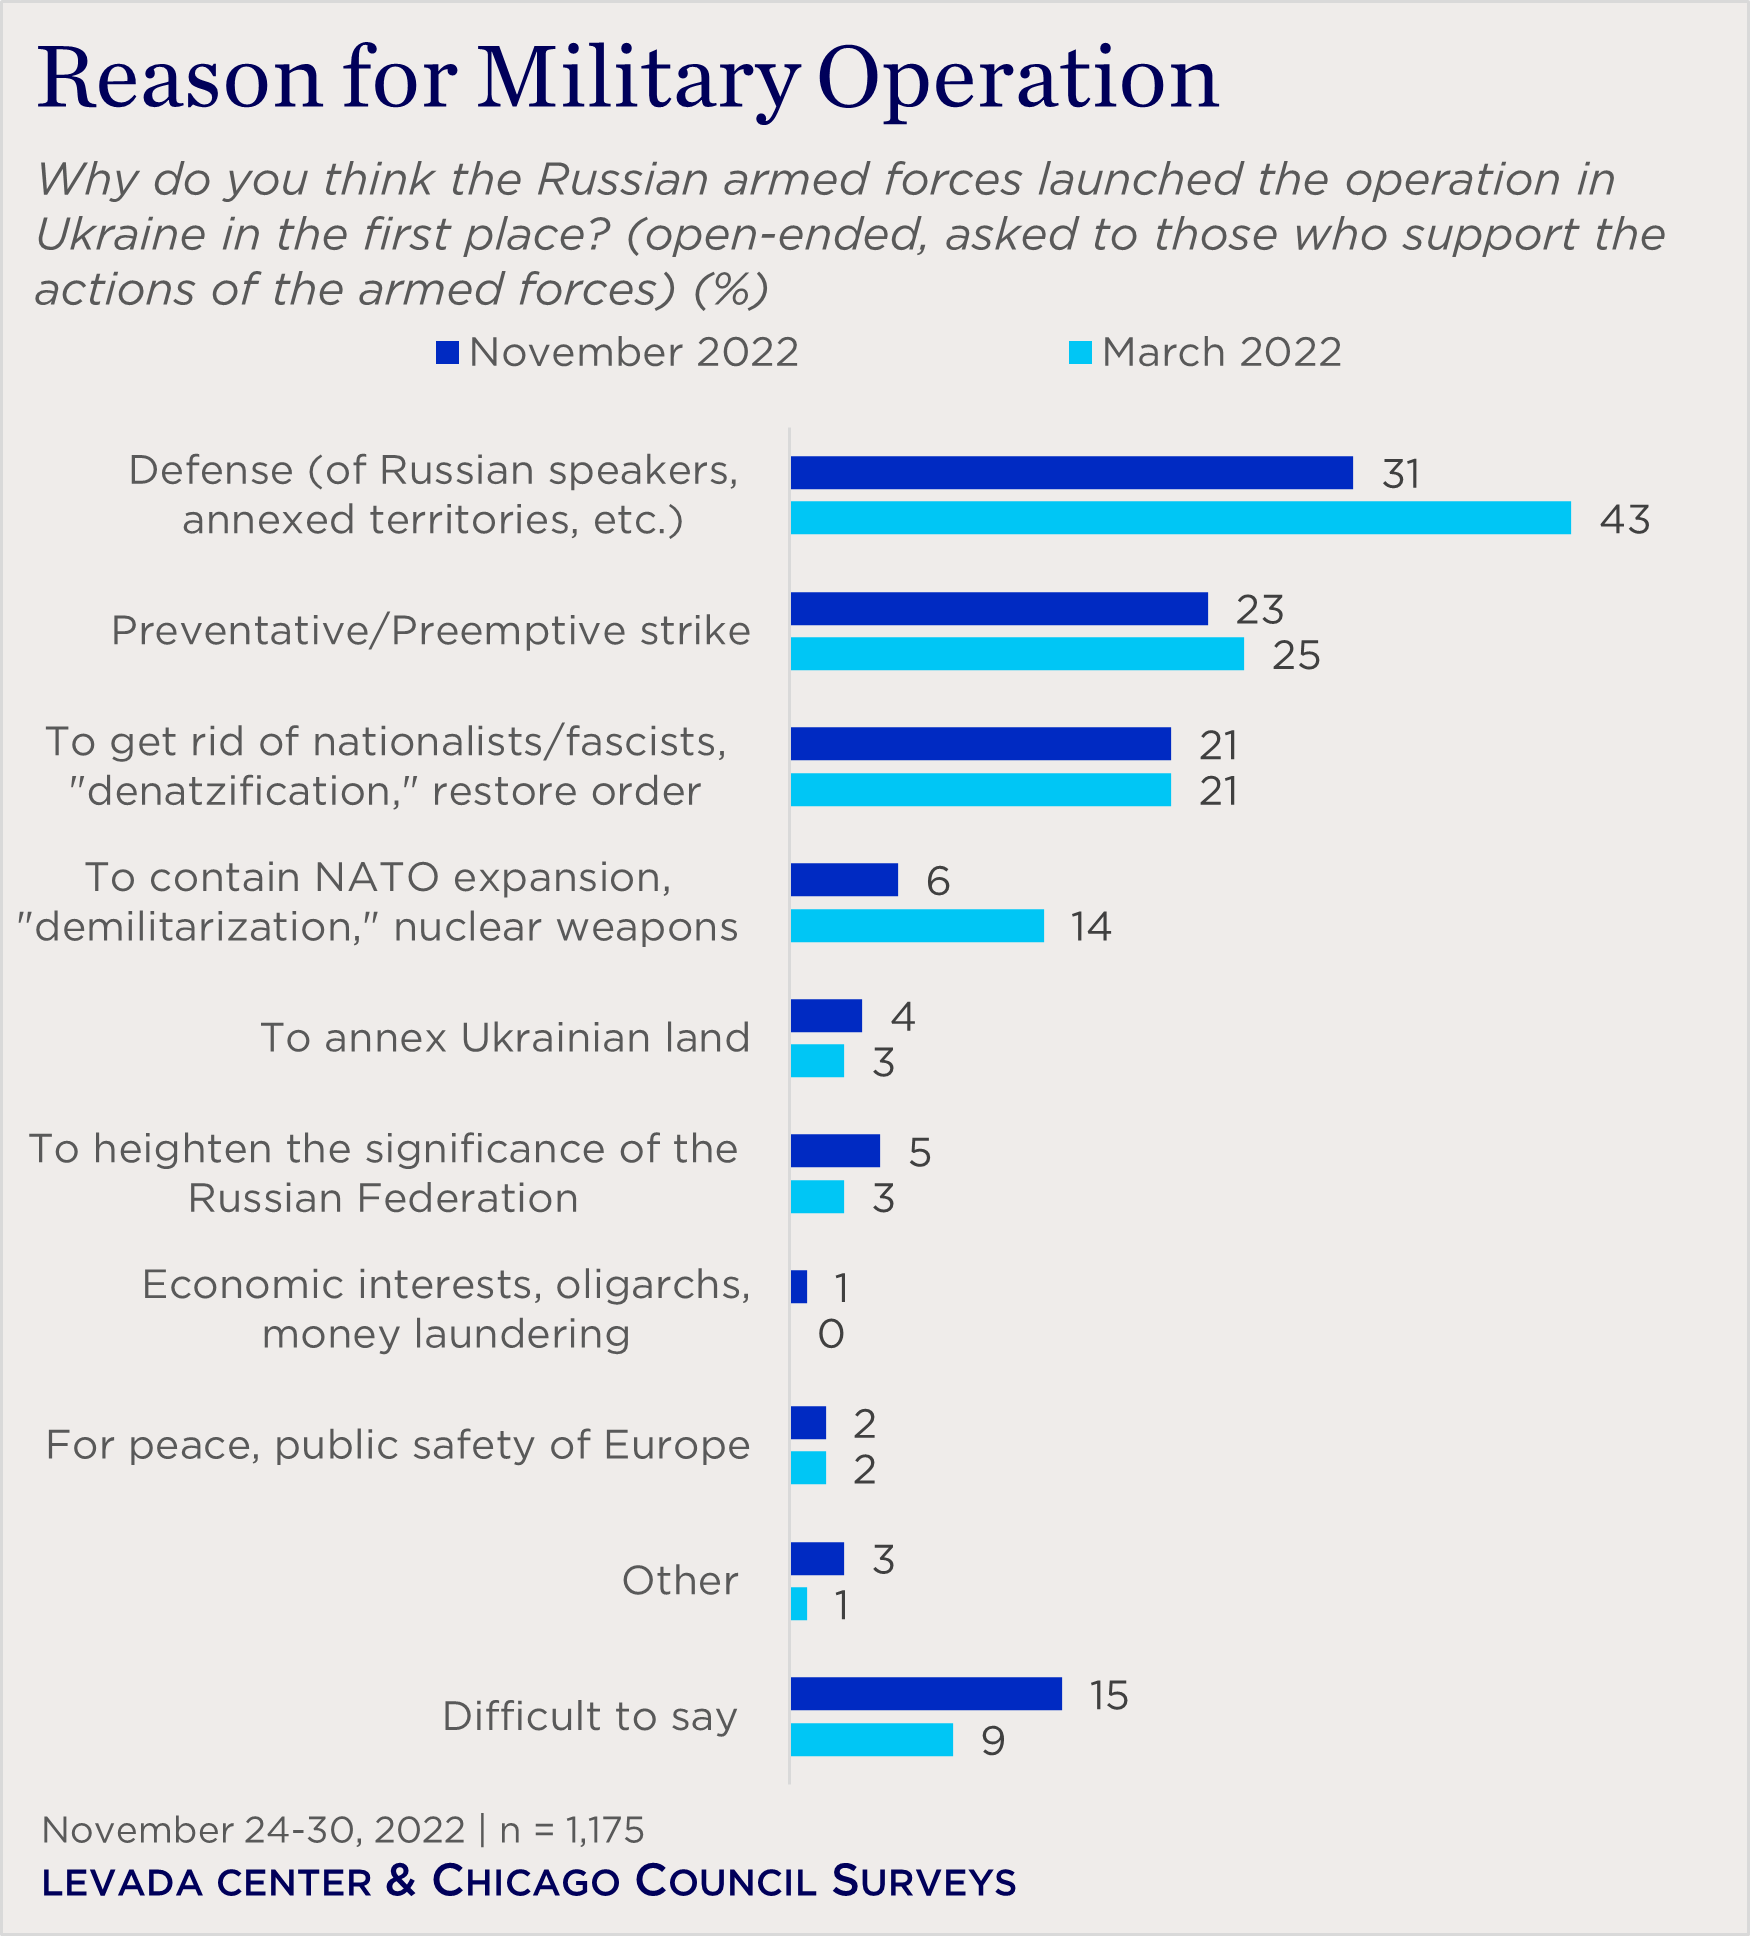
Few Russians say the primary reason behind the military operation is to annex Ukraine or part of Ukraine (4%). For the most part, the Russian public accepts the line put forth by the Kremlin that the military operation aims to protect the Russian-speaking population in Ukraine including in the Donbas (31%), prevent an external attack on Russia (23%), or to rid Ukraine of “nationalists,” “Nazis,” and “fascists” (21%). Only 6 percent believe it is mainly to contain NATO expansion.
Uncertainty about Benefits of the Military Action
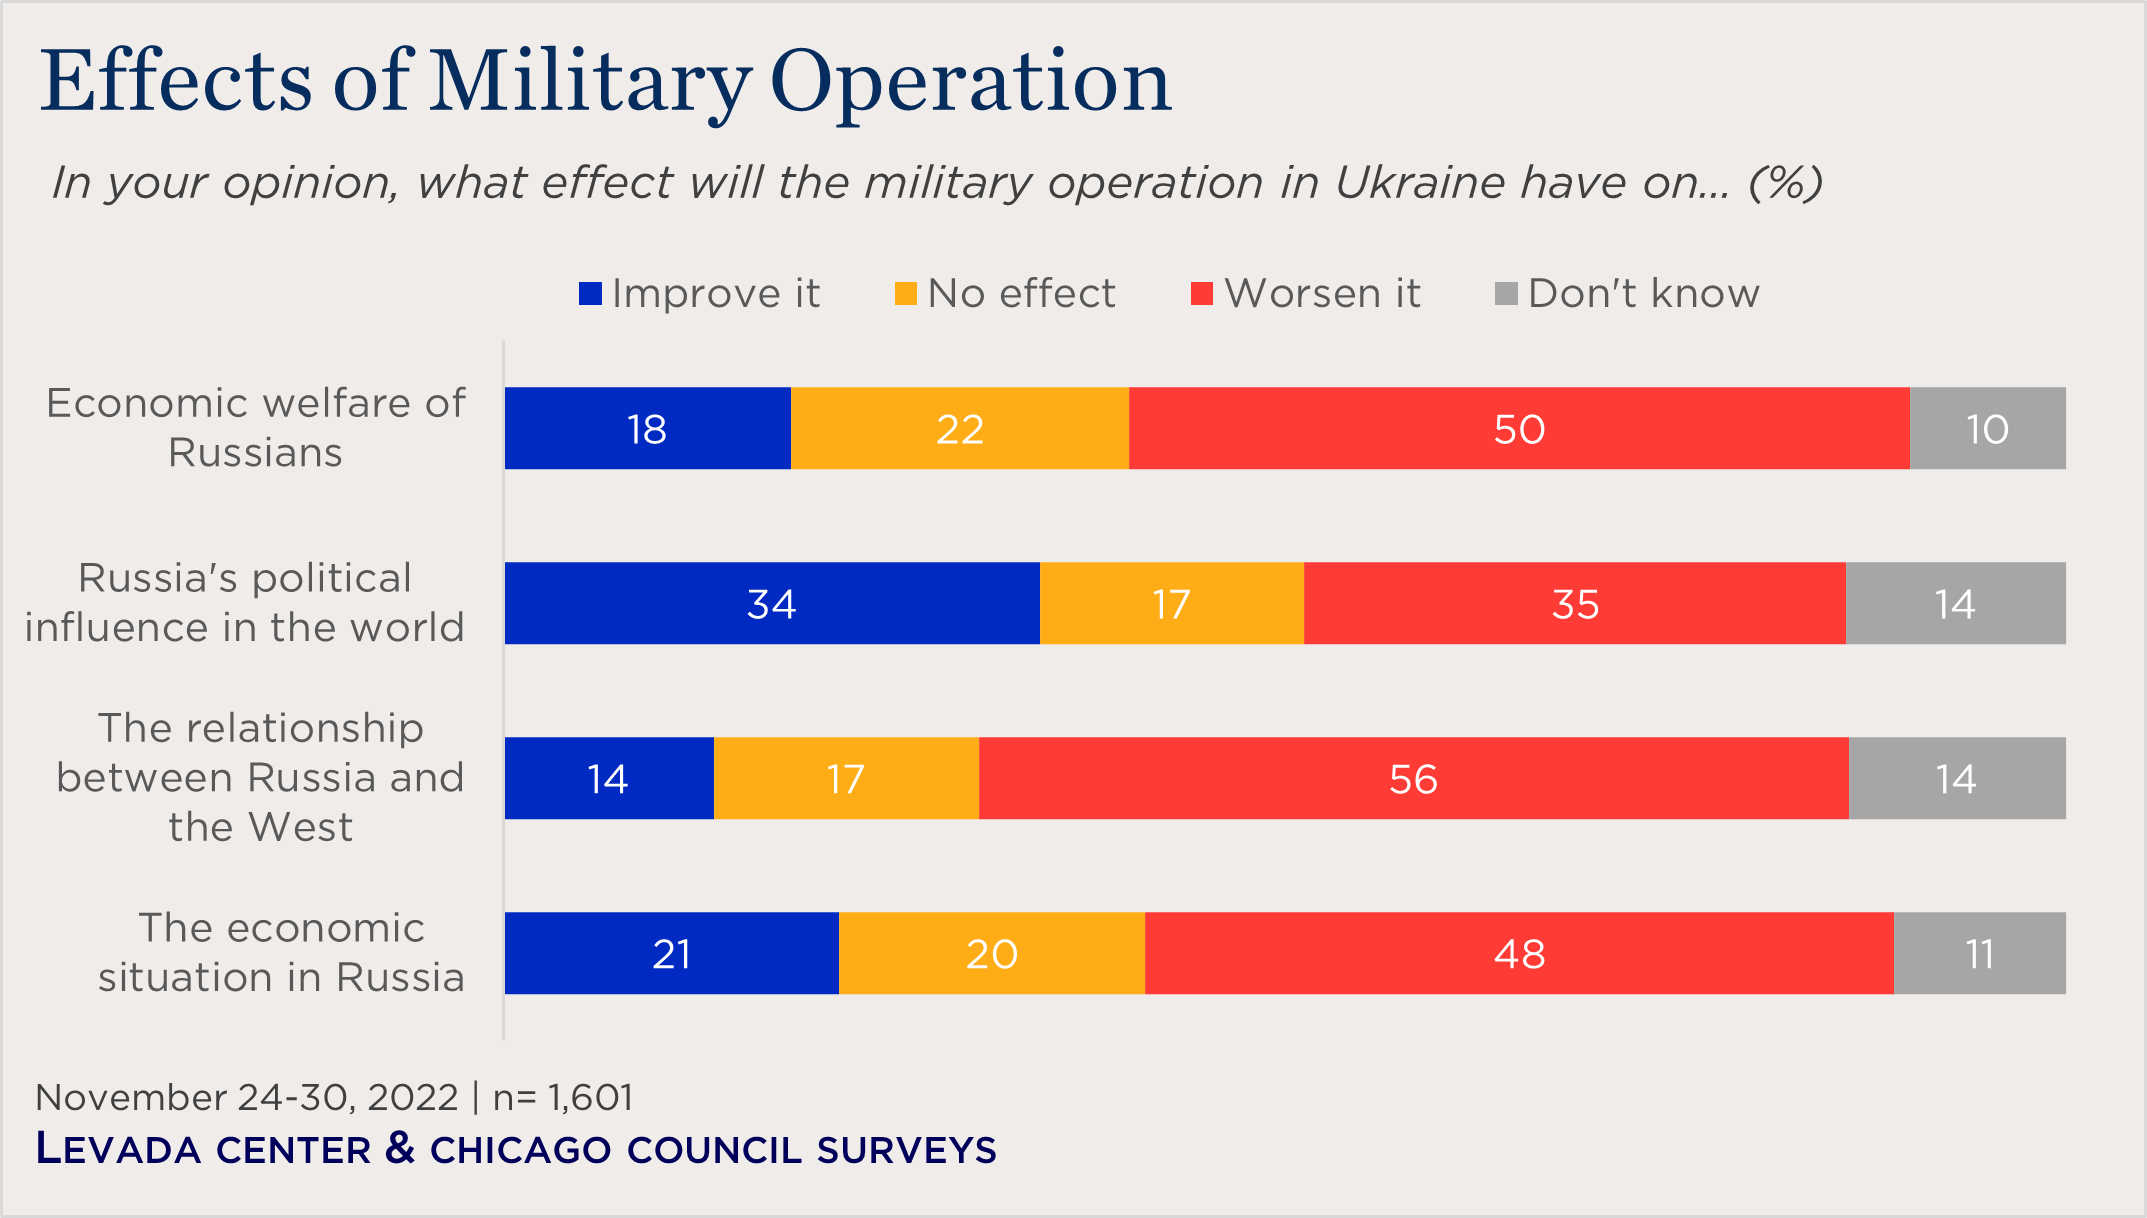
While support still seems to be fairly solid at first glance, there are some signs Russians are beginning to question what benefits the military operation will bring. A majority (56%) think the action will worsen Russia’s relations with the West, though previous polling suggests that even if this is the case, it is not much of a concern for everyday Russians. More say it will worsen than improve the economic welfare of Russians and the economic situation in the country. And as many say it will worsen as say it will improve Russia’s political influence in the world.
Only a Narrow Majority Think Military Operation Has Been Successful
While overall support is still at majority levels, confidence in the success of the operation is less widespread. A slim majority of 53 percent think the operation in Ukraine has been successful compared to 31 percent who say it has been unsuccessful. An additional 16 percent are unsure.
A majority of those who think the operation has been successful support continuing the effort (51% vs. 46% negotiate), but most of those who think the operation has been unsuccessful would rather support peace negotiations (65% vs. 31% continue operation). Majorities of both the groups that see the operation as successful and unsuccessful say they support the operation, although support is stronger among those who think Russia is succeeding.
Many Russians Seem Ready to Move toward Negotiations. . .
By a 5 to 4 ratio, Russians think their government should start peace negotiations (53%) over continuing the special military operation (41%).
When specific costs of war are included in the question—inflated prices and the risk to soldiers’ lives—an even higher percentage choose negotiation over continued military action. By a 5 to 4 ratio, more Russians choose the path of peace negotiation so that “costs aren’t as great for Russian households” versus continuing the military operation even if Russian households would have to endure higher prices due to sanctions. The ratio increases to 6 to 3 in favor of peace negotiations when the question frames negotiations as “to avoid the loss of life of more Russian soldiers.”
. . .But Are Opposed to Territorial Concessions
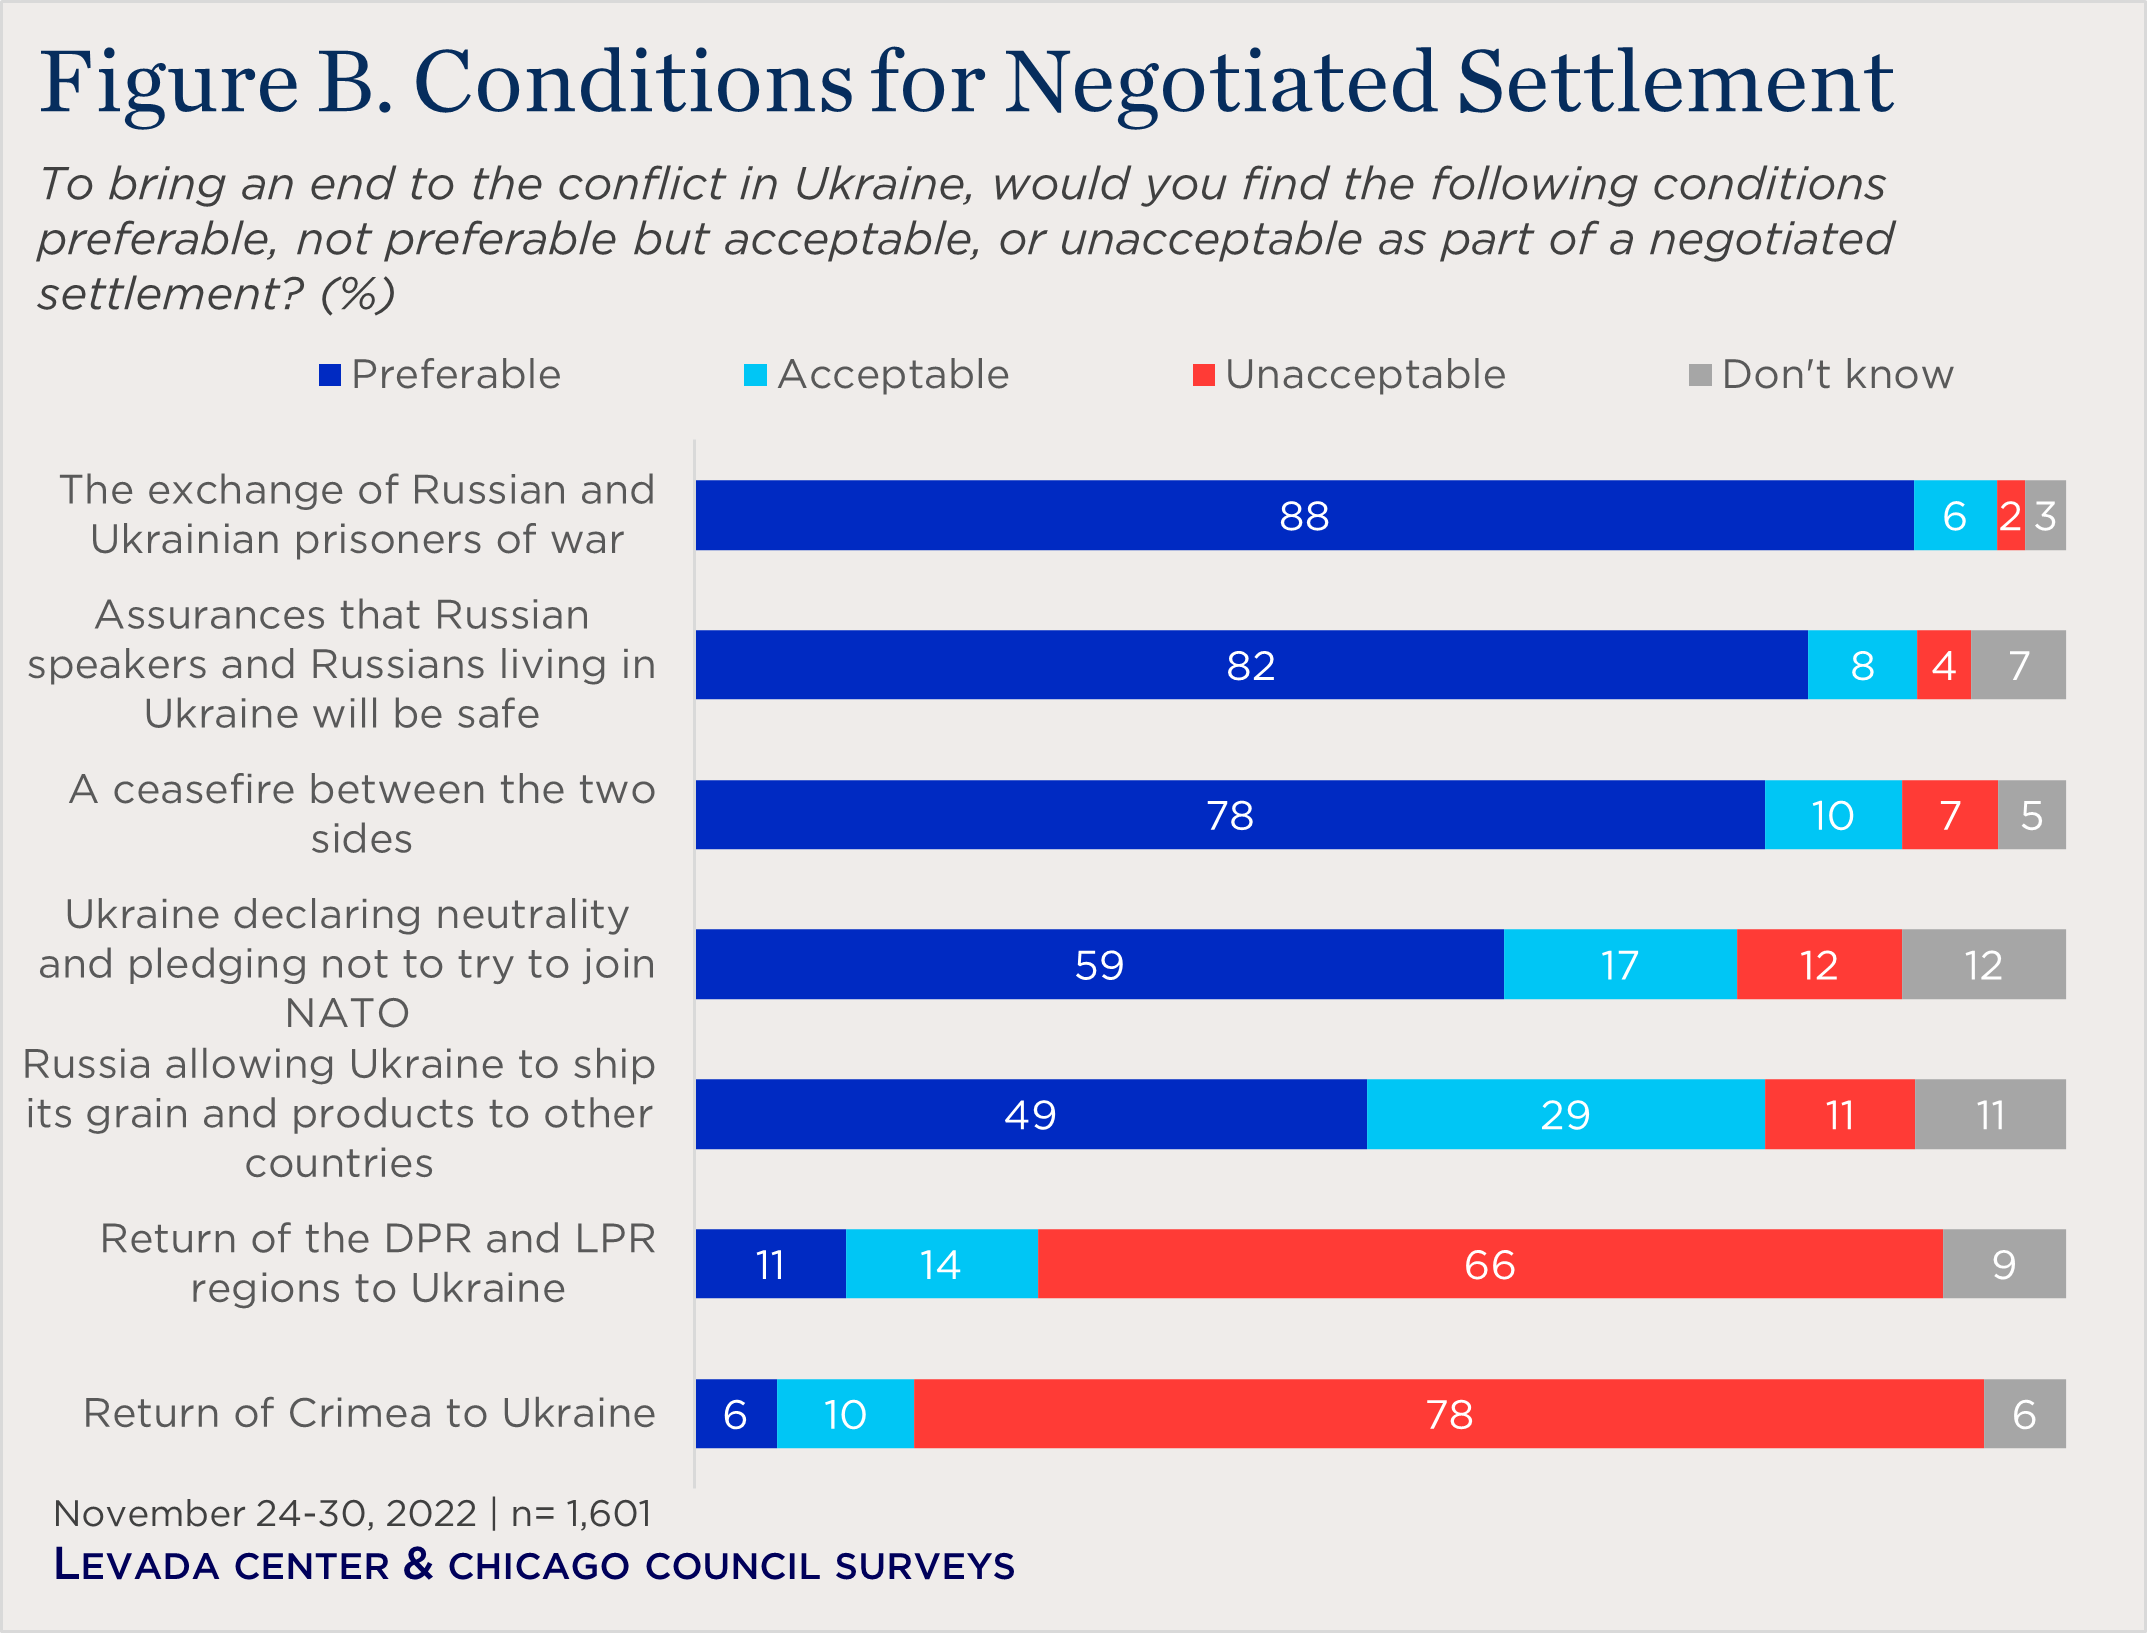
While there seems to be some appetite for negotiations to end the conflict—whether it is to cement Russia’s current territorial gains on the battlefield or to avoid another mobilization or protracted war—it’s unclear what Russians would be willing to concede. Solid majorities of Russians say it is unacceptable to return Crimea (78%) or the occupied Donbas region (66%) to Ukraine.
Eight in 10 say it is at least acceptable that Ukraine resumes shipping grain and other products to other countries (78%), and nearly all Russians support a reciprocal POW exchange (94%) and a cease-fire (88%). And developments in Russia’s favor are considered acceptable if not preferred, including Ukraine declaring neutrality and not joining NATO (76%) and assurances for the security of Russians and Russian speakers in Ukraine (90%). (Appendix Figure B)
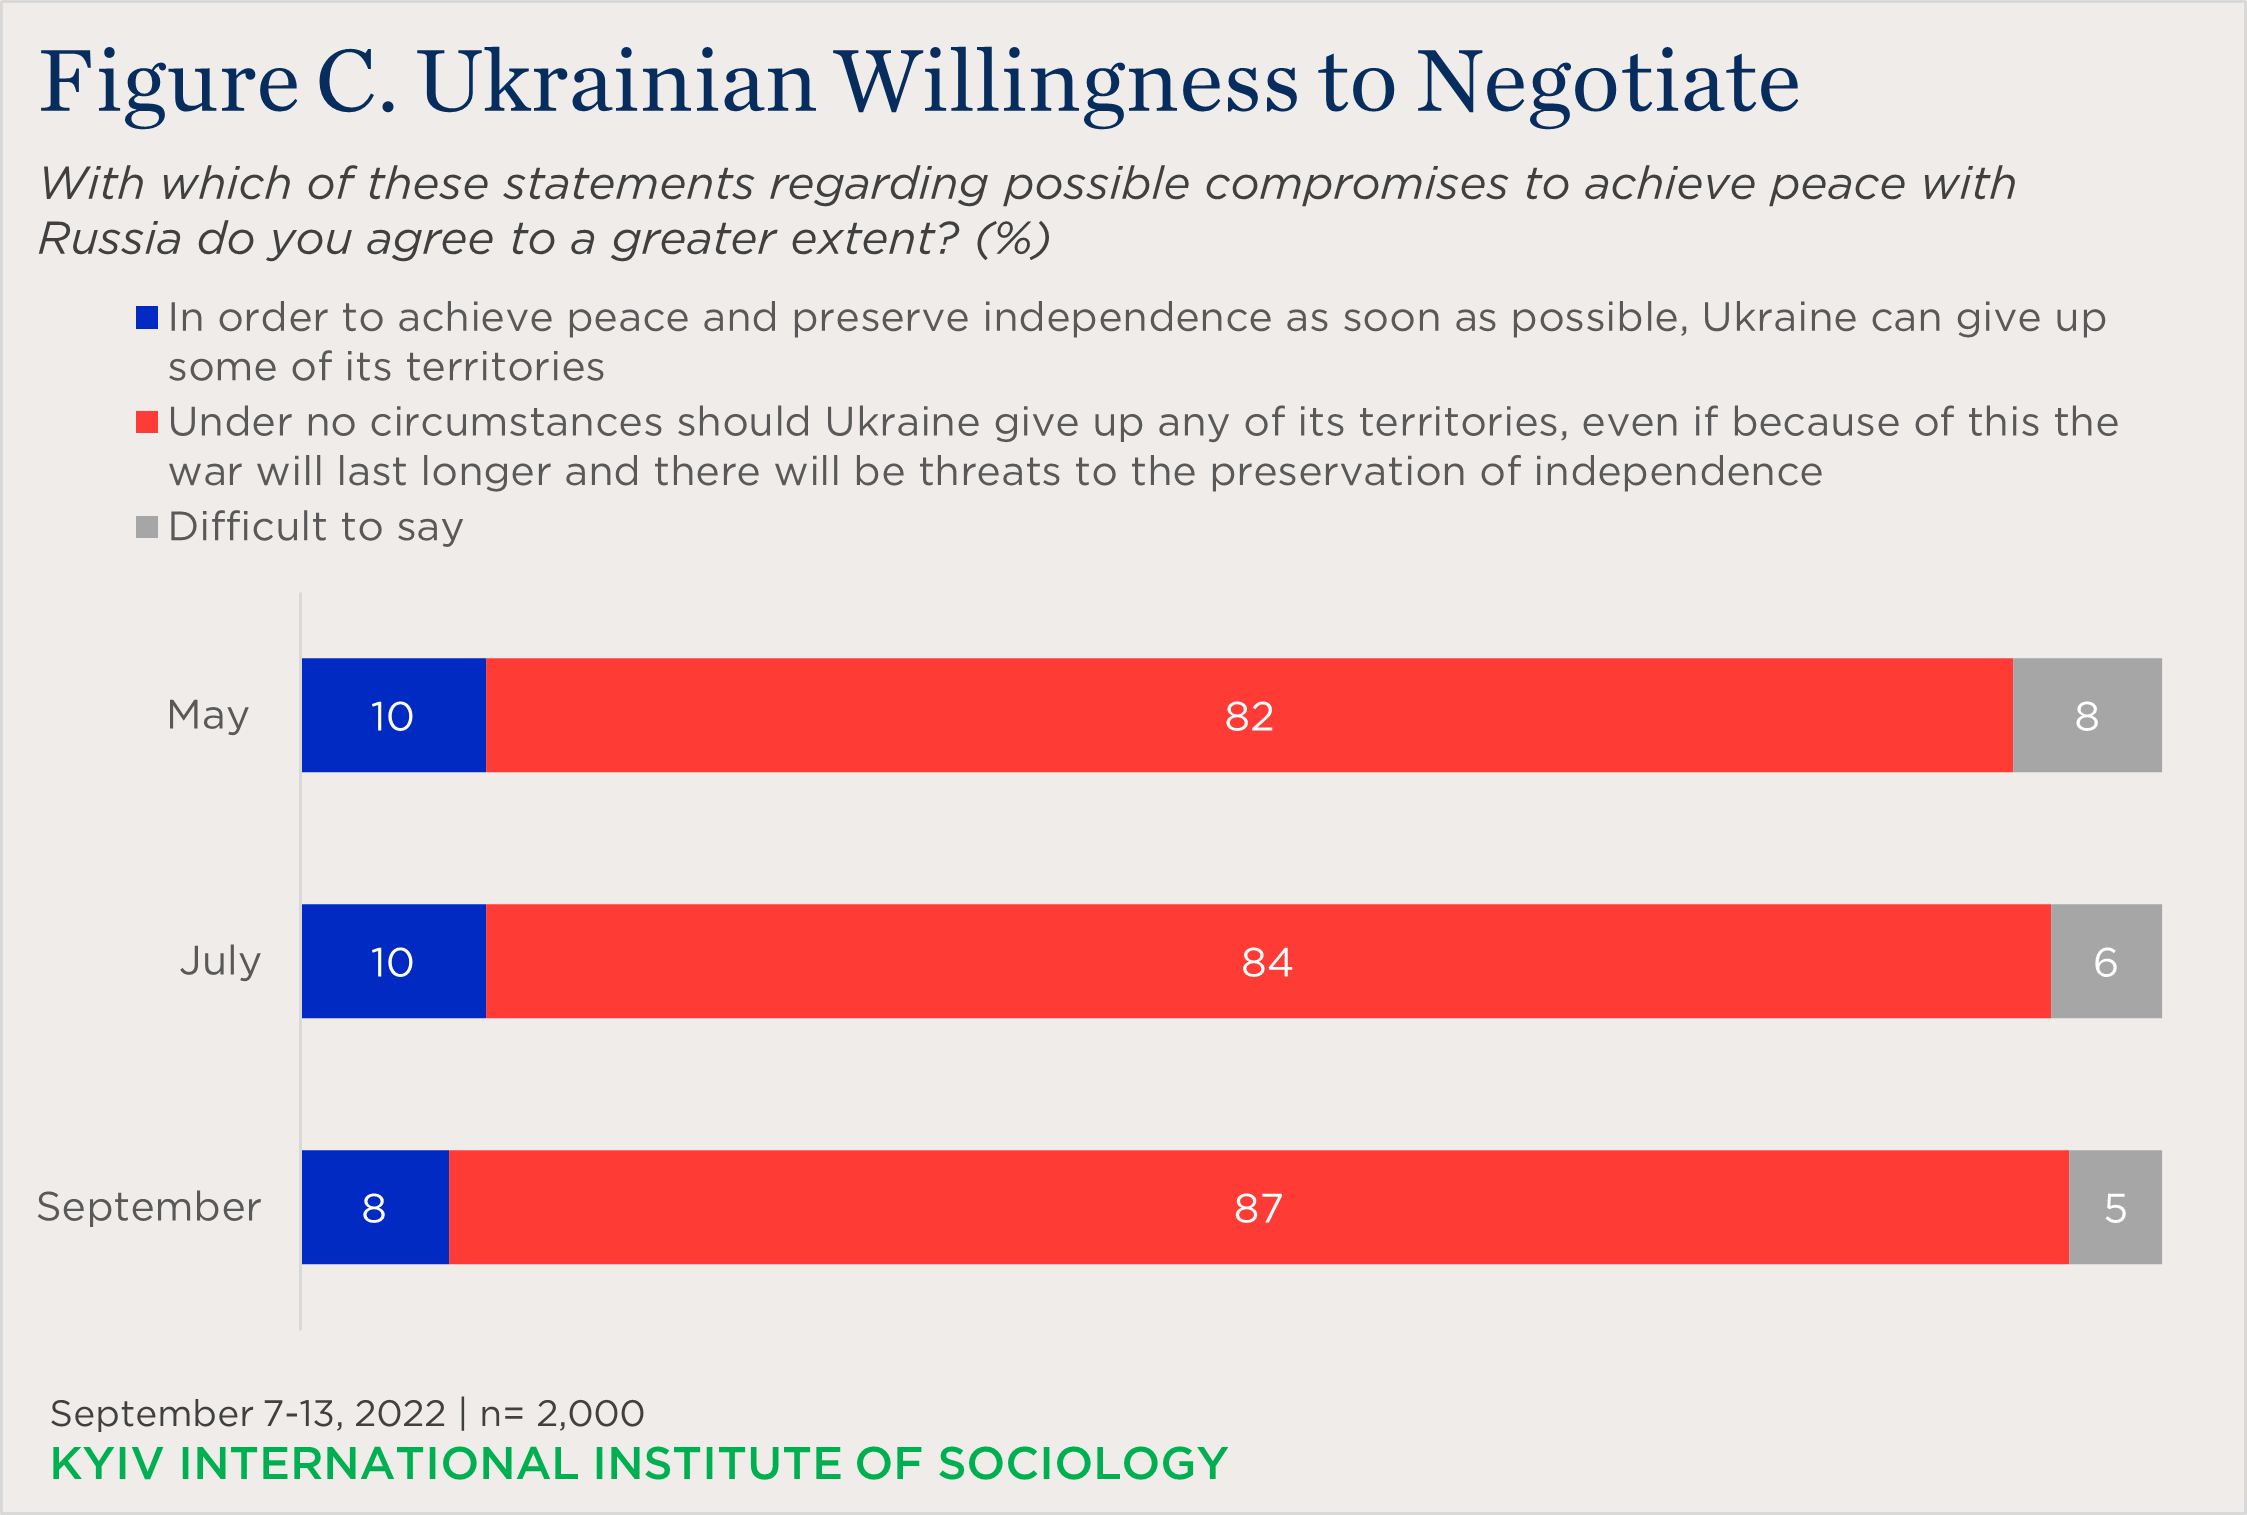
Recent polling in Ukraine show Ukrainians are also unwilling to give up the occupied areas to Russia. In a September 2022 Kyiv International Institute of Sociology(KIIS) survey, nearly nine in 10 Ukrainians said that under no circumstances should Ukraine give up territories to Russia, even if this meant prolonging the war (87%, up from 82% in May 2022). These results, combined with Russian refusal to cede their military gains, underscore the challenge of territorial control for any negotiations. In May, KIIS polling found that a plurality of Ukrainians was willing to accept security guarantees from key NATO members in place of actual acceptance into the alliance. If that willingness among Ukrainians still holds, Ukraine’s NATO aspirations could be one potential area of compromise between the two countries. (Appendix Figure C)
Conclusion
Taken together, the data show that the majority support among Russians for the military operation in Ukraine is softer than it might seem at first glance. A sizable portion of the Russian public say they would be willing to end the military operation and move to peace negotiations. But it is unclear what meaningful concessions Russians would be willing to make to Ukrainians, aside from a cease-fire and prisoner exchanges.
- 1
Because of the Russian government restrictions on the use of certain terms to describe the Russian military action in Ukraine, the joint survey used either “[special] military operation” or “military action” in these questions. To be true to the results, we use that language throughout this report.
- 2
A separate question (not included in this report) shows that television is the most trusted news source (46%), followed by social media (19%), internet websites (17%), Telegram channels (14%), friends and relatives (11%), radio (8%), and printed news (5%). Seventeen percent of respondents say there is no media to trust (17%). Respondents were able to select multiple news sources they trust.


This survey was part of Levada’s monthly omnibus survey. Read the full methodology.
For this particular wave of the Levada Center’s monthly omnibus survey, the interviews were conducted between November 24–30, 2022 among a representative sample of all Russian urban and rural residents. The sample was comprised of 1601 people aged 18 or older in 137 municipalities of 50 regions of the Russian Federation. The survey was conducted as a personal interview in respondents’ homes. The answer distribution is presented as percentages of the total number of participants along with data from previous surveys.
The statistical error of these studies for a sample of 1600 people (with a probability of 0.95) does not exceed:
- 3.4% for indicators around 50%
- 2.9% for indicators around 25%/75%
- 2.0% for indicators around 10%/90%
- 1.5% for indicators around 5%/95%
This work is made possible by the generous support of the Carnegie Corporation of New York.

Related Content
 Public Opinion
Nearly half of Americans (47%) now say Washington should urge Kyiv to settle for peace as soon as possible.
 Public Opinion
American perceptions of whether Russia or Ukraine is winning the war are key to support for ongoing US assistance to Kyiv.
 Public Opinion
Consensus on how long to provide economic and military aid to Ukraine appears to be weakening as the war enters its tenth month.
 Public Opinion
Survey results show the public remains supportive of US assistance to Ukraine—even if it means paying higher gas and food prices at home.