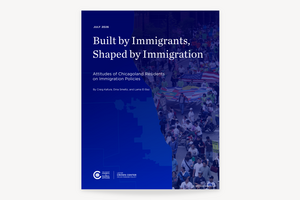
Results and analysis of the Council's survey of Chicagoland residents on immigration policies.
Executive Summary
It’s no exaggeration to say that immigration made Chicago what it is today. The 19th century saw Chicago transform from a small trading post on Lake Michigan and the Chicago River into a global metropolis. Its railroads, canals, and meatpacking industry beckoned opportunity to new immigrants and made Chicago the “Hog Butcher for the World” and “the Nation’s Freight Handler.” Today, 1.6 million immigrants call the Chicago metropolitan region home, representing 19 percent of the total regional population.
Chicagoland Residents Consider Immigrants a Positive Force
Across the city of Chicago, suburban Cook County, and Lake County, six in 10 residents say immigrants have been good for American culture, the US economy, their local economy, and their own communities, similar to overall Americans in a Chicago Council 2025 national survey. Majorities also value immigrants’ importance to US agriculture, hospitality industries, construction, healthcare, science and technology, arts and culture, and higher education.
About half of Chicago area residents believe that increasing the number of people of different races, nationalities, and ethnicities makes the country a better place to live compared to about a quarter who say it makes it a worse place (a quarter say no difference), similar to US overall opinion. And more than nine in 10 residents of Chicago, suburban Cook, and Lake County say Chicago has historically been a welcoming place for immigrants.
Most Chicagoland Residents Favor Increasing or Maintaining Legal Immigration
Roughly eight in 10 in Chicago, suburban Cook County, and Lake County favor either increasing legal immigration or maintaining it at its present level, with opinion split about equally between the two. Relatively few (no more than 21%) in Chicago, suburban Cook County, or Lake County favor decreasing present levels of legal immigration. As a point of reference, support for immigration levels hit a new national high in the 2025 annual Chicago Council Survey of the American public, with 49 percent saying it should be kept at present levels and 28 percent preferring to increase it (21% decrease).
Having Necessary Skills Considered Most Important for Immigrants
More than any other attribute, eight in 10 Chicagoland residents think it is important that immigrants selected for admission to the United States have skills needed in our country. Two-thirds or more also consider having a sponsor or family member in the United States with legal status important, along with speaking English. Majorities—especially those in suburban Cook County—also think it is very important that immigrants selected for admission don’t use social benefits such as healthcare or food assistance.
Most Criteria for Refugee Status Widely Accepted by Chicagoland Residents
Asked about reasons refugees might be accepted into the United States, three-quarters of Chicago area residents say that war and political instability; persecution for political beliefs; discrimination due to race, ethnicity, or religion; and climate disasters are all valid reasons for granting refugee status. Roughly seven in 10 Chicagoans say the same about discrimination due to gender or sexual orientation and economic instability. Chicago residents are, in fact, more supportive of accepting refugees than Americans overall, according to a Chicago Council – Ipsos nationwide survey conducted in April 2026.
Most Favor Allowing Undocumented Immigrants to Apply for Citizenship
Asked what should be done regarding undocumented immigrants, at least six in 10 Chicagoans (66%) and Lake County residents (61%) favor allowing them to apply for citizenship. Half of suburban Cook County residents (52%) agree. Suburban Cook County residents’ attitudes are on par with the national average (51%), according to the Council’s April 2026 nationwide poll, while Chicago and Lake County residents are more likely than the national average to favor a path to citizenship.
Additionally, eight in 10 Chicagoans (79%), and seven in 10 suburban Cook County and Lake County residents (72% each), favor granting permanent legal status to “Dreamers,” those who were brought to the United States without legal status as children. Americans nationally also favor granting permanent legal status to Dreamers (68%), with Chicago residents are disproportionately supportive compared to the national average.
Conclusion
Chicago was built by immigrants, and their impact is evident across the city and in the surrounding suburbs and collar counties. As this survey of Chicagoland shows, residents don’t just see Chicago as having been a welcoming city in the past—they continue to welcome new Chicagoans from around the world. Yet just as is true across the country, there are sharp partisan differences on many immigration-related issues, including which immigrants should be admitted into the country, the best way to address undocumented immigrants, and what criteria merit offers of refuge for those fleeing their countries.
Chicago is one of the great immigration gateway cities for the United States, and immigrants have left their mark on the city and in the surrounding suburbs. These include the immediate suburbs in Cook County (within which the city of Chicago sits) as well as in the surrounding five “collar counties” of Lake, McHenry, Kane, DuPage, and Will. Often broadly referred to as Chicagoland, the area continues a tradition as home to one of the United States’ “largest and most diverse” immigrant populations.
To better understand how Chicagoland residents think about immigration and immigrants, and how local attitudes reflect or differ from national opinion, the Chicago Council on Global Affairs conducted an in-depth survey of local residents: the Chicagoland Immigration Survey, fielded April 13–23, 2026, in Cook County (n=1500) and Lake County (n=400). Cook County can be further divided into the city of Chicago (n=758) and suburban Cook County (n=742). Because of the smaller size of the Lake County samples, analysis by partisanship, race, or education are only reported for Cook County results.
| Chicago | Suburban Cook County | Lake County | |
|---|---|---|---|
| N (sample size) | 758 | 742 | 400 |
| Partisanship (%) | |||
| Republican | 13 | 23 | 27 |
| Democrat | 56 | 45 | 39 |
| Independent | 30 | 31 | 34 |
| Race/Ethnicity (%) | |||
| Black/African American | 25 | 16 | 6 |
| White/Caucasian | 34 | 49 | 58 |
| Hispanic/Latino | 29 | 21 | 23 |
| Asian American/Pacific Islander (AAPI) | 8 | 10 | 9 |
| Other | 3 | 3 | 1 |
| Age (%) | |||
| 18–29 | 23 | 18 | 21 |
| 30–44 | 32 | 23 | 24 |
| 45–59 | 20 | 24 | 27 |
| 60+ | 25 | 34 | 28 |
The Chicagoland Immigration Survey was fielded for the Chicago Council on Global Affairs by Global Strategy Group, which conducted a survey of 1,500 adults 18 or older in Cook County and 400 adults 18 or older in Lake County from April 13–April 23, 2026.
The study was fielded in English and Spanish in a mixed-mode telephone (landline and cell) and text-to-web, with the telephone and text-to-web invitations both using random digit dialing. The margin of error for the Cook County sample is ±2.5%, and the margin of error for the Lake County sample is ±4.9%.
| Region | Margin of Error | Partisanship (Cook Only) | Margin of Error | Race/Ethnicity (Cook Only) | Margin of Error |
|---|---|---|---|---|---|
| Chicago | ±3.6 | Republican | ±6.0 | Black and African American | ±6.5 |
| Suburban Cook County | ±3.6 | Democrat | ±3.6 | White or Caucasian | ±3.4 |
| Lake County | ±4.9 | Independent | ±4.5 | Hispanic or Latino | ±5.8 |
| Asian American and Pacific Islander | ±10.1 |
The data for both the Cook County and Lake County samples were weighted to adjust for gender, age, race/ethnicity, education, PUMA (Public Use Microdata Area), and 2024 presidential vote. The demographic benchmarks came from the US Census Bureau’s 2024 American Community Survey 1-Year Estimates Public Use Microdata Sample (ACS 1-Year PUMS). Self-reported 2024 presidential vote choice was weighted to the 2024 results in Lake and Cook County.
Specific categories used in weighting were:
- Gender (Male, Female)
- Age (18–29, 30–44, 45–54, 55–64, 65+)
- Race/Ethnicity (White Non-Hispanic, Black Non-Hispanic, Asian Non-Hispanic, Hispanic, and Other/Multi-Racial)
- Education (College, Non-College)
- PUMA (City of Chicago, Rest of Cook County, Lake County)
- 2024 Presidential Vote (Harris/Trump)
The Chicagoland Immigration Survey was made possible through the generous support of the Walder Foundation and Schreiber Philanthropy.
Additional Analysis





Related Events

Related Content
 Public Opinion
While most Republicans echo Trump's view that immigration negatively impacts the United States, a majority of Americans feel differently.
 Migration
While majorities of Democrats and Independents support a path to citizenship for immigrants living and working in the United States illegally, only four in 10 Republicans agree.
 Geopolitics
Republican Party supporters stand out as the only partisans in favor of using the military for domestic law enforcement, to suppress protests, and to control immigration.
 Public Opinion
Survey data show that regardless of when they arrived in the United States, immigrants embrace a shared vision for US foreign policy.