Refugees Welcome? Americans Support Taking in Afghans, Ukrainians, Taiwanese
Despite public divisions over US aid to Ukraine, support for taking in those fleeing the Russian invasion remains unchanged since March.
Polls over the decades have generally found low levels of support for taking in refugees from other parts of the world. As our own Isabelle Grassel wrote in August, “Americans have long opposed accepting refugees into the United States, even during some of the world’s darkest moments.” The most famous of example of this may be the US refusal to accept European Jews fleeing Nazi Germany in 1939, a policy that continued throughout the war. That general anti-refugee sentiment persisted among Americans throughout the 20th century and into the 21st, with the public opposing the admission of refugees from countries as varied as Hungary (1957), Vietnam (1979), and Syria (2016). However, several recent surveys from the Chicago Council have shown majority—and sometimes bipartisan—support for accepting particular refugee groups.
Support for Accepting Refugee Groups into the United States
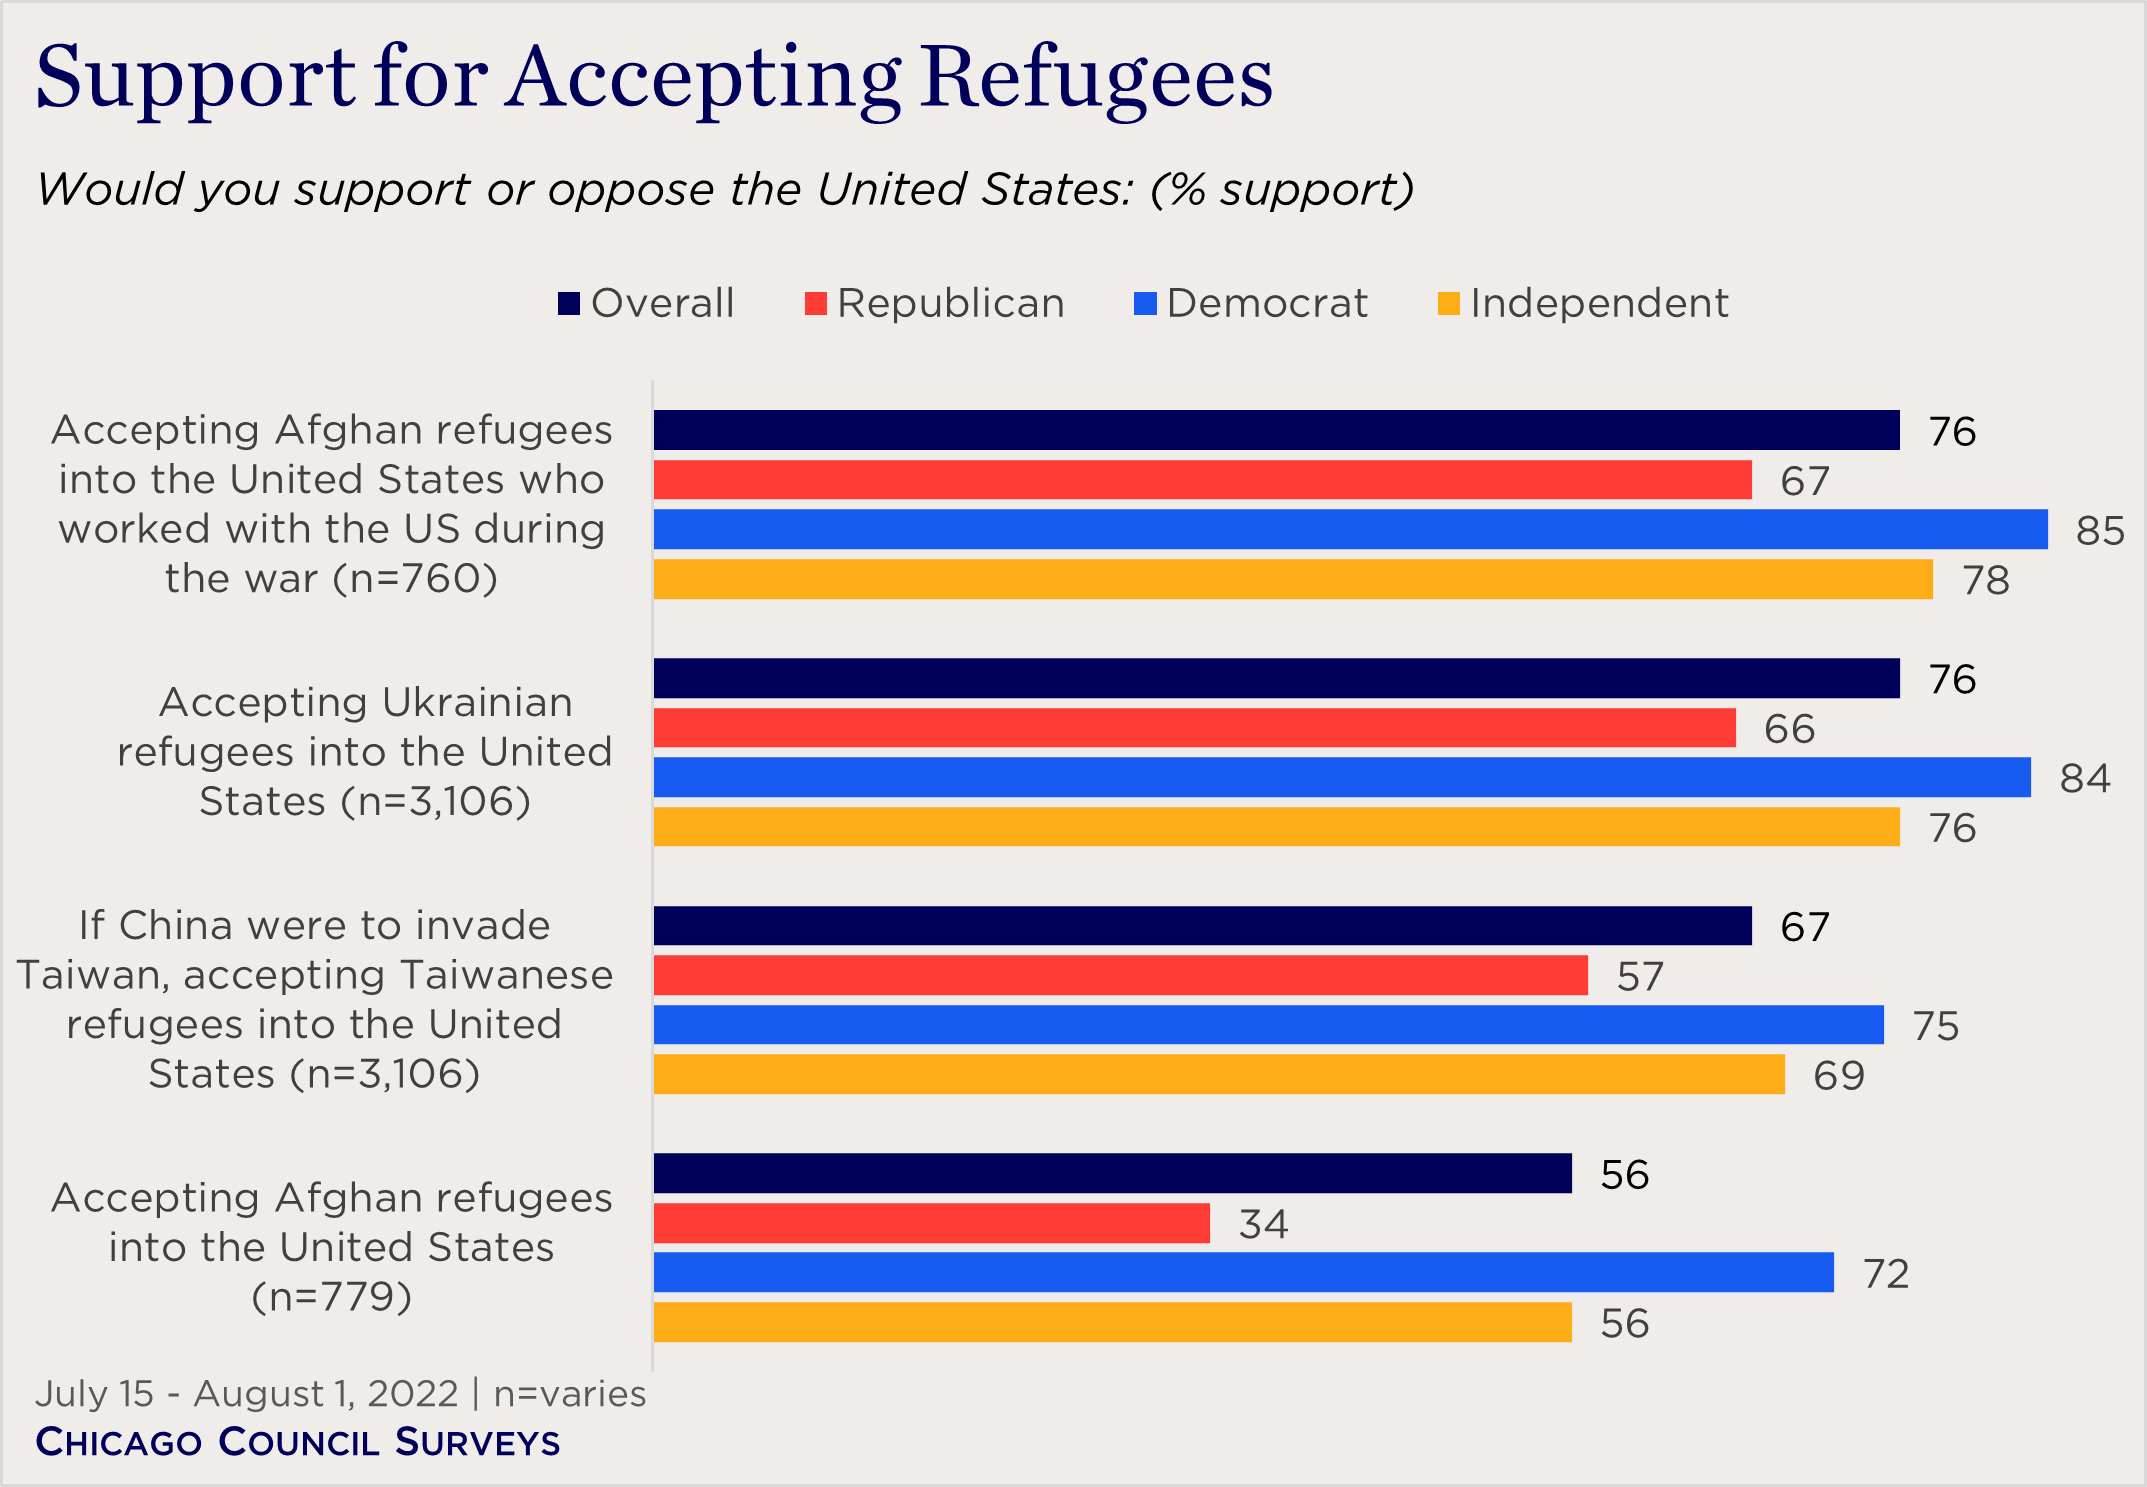
Across four different scenarios in the 2022 Chicago Council Survey, majorities of Americans support taking in refugees from other countries. This includes bipartisan support for taking in Ukrainian refugees and Taiwanese refugees should China invade the island. Majorities of Americans also support taking in Afghan refugees, both those who worked with the United States during the war (76%) and others fleeing the country (56%).
However, Republican support for Afghans’ admission to the United States hinges on whether the Afghans in question worked with the United States during the 20-year war in Afghanistan. Two-thirds of Republicans (67%) support taking in those Afghans who worked with the United States during that war, compared to just a third (34%) who support accepting Afghan refugees in general. Support among Democrats is less variable between the two groups, with large majorities saying the country should accept those who worked with the United States (85%) and Afghans more broadly (72%).
Intraparty Splits on Refugee Admissions
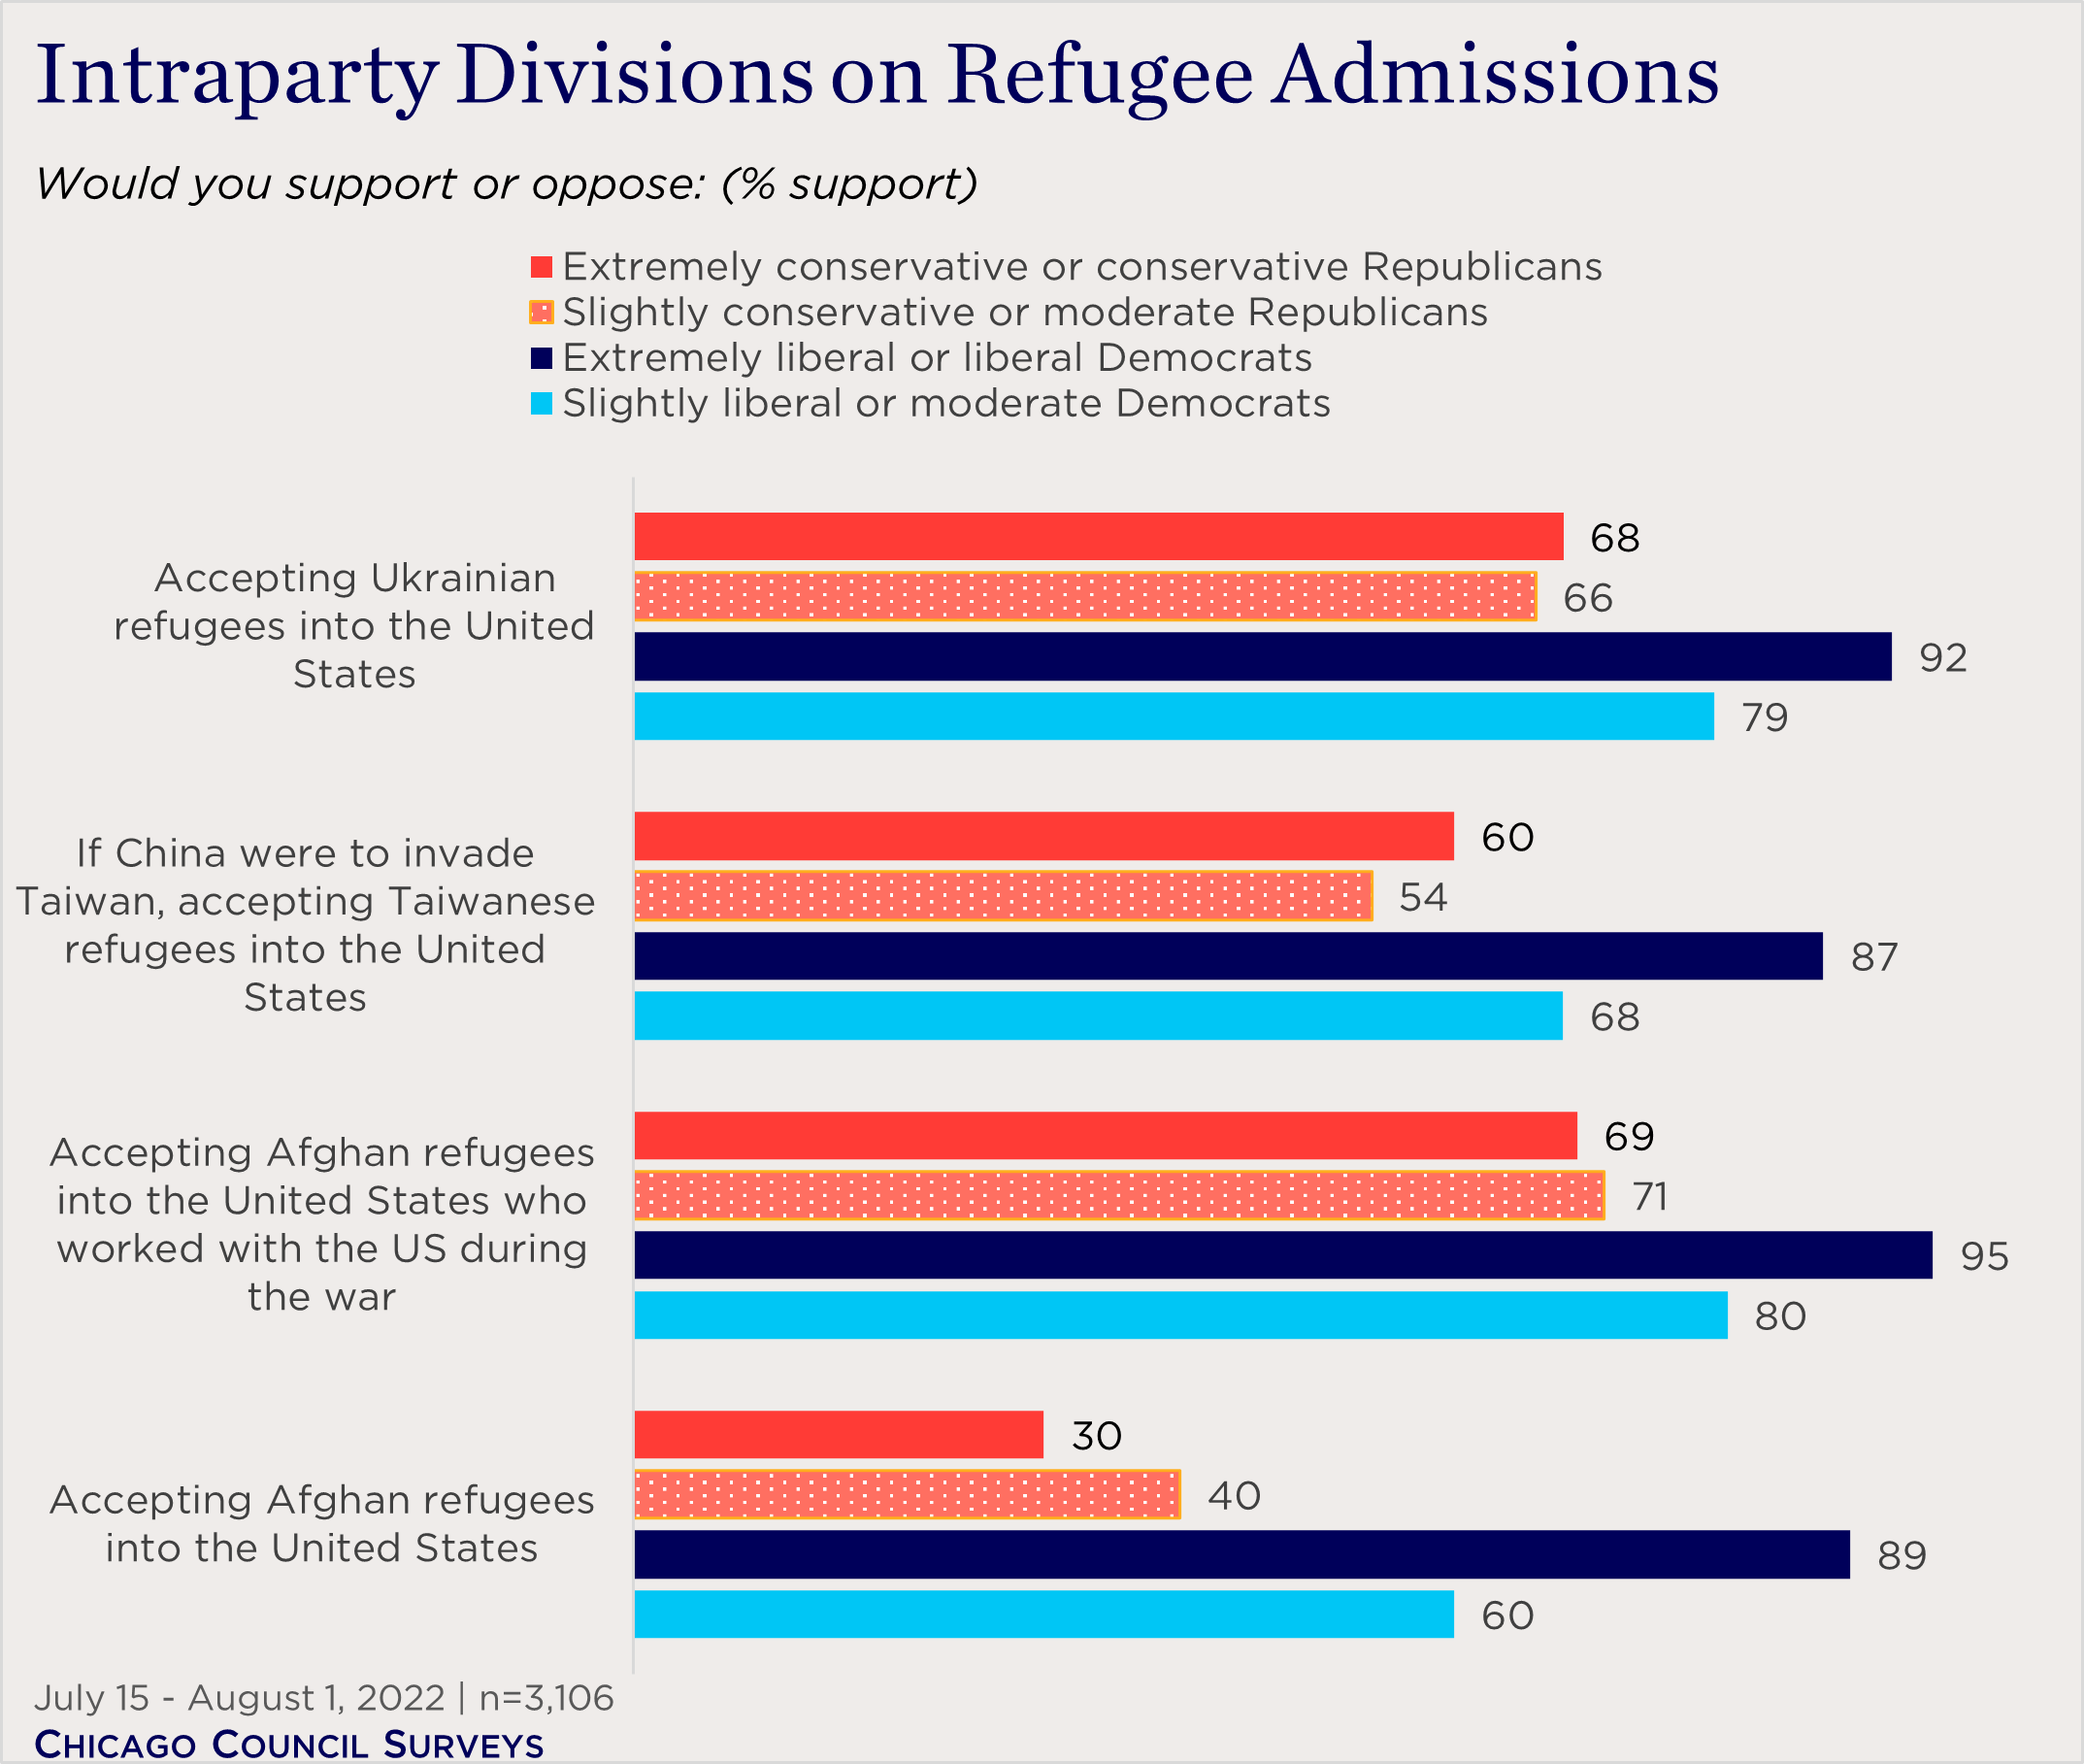
As observers of American politics will know, the constituencies of the two parties are not monoliths, and members of the same party often disagree on the specifics of an issue. Immigration is no different. Particularly among Democrats, there are significant intraparty divisions when it comes to refugee admissions.
Overall, Democrats are consistently more likely than other Americans to support admitting refugees to the United States. However, across all the scenarios asked about in the Council’s polling, the level of support among moderate Democrats is closer to that of Republicans than it is to the level of support among the more liberal members of their own party. This division is starkest in the case of Taiwanese refugees, where support among moderate Democrats is only eight points higher than that of conservative Republicans, but trails support levels among more liberal Democrats by 19 points. This division does not come through as strongly at the policymaking level, where even the most moderate Democrats have strongly supported Afghan and Ukrainian refugees in both their rhetoric, and with their votes in Congress.
Moderate and more conservative Republicans among the public are generally aligned both with each other and with their representatives in Congress when it comes to support for Ukrainian refugees. Republican lawmakers across the ideological spectrum have supported programs to admit Ukrainian refugees. However, on Afghanistan, the views of the public are not necessarily in lockstep with the policy preferences of their representatives. For example, among the public, neither moderate nor conservative Republicans support admitting Afghan refugees who are not specified to have worked with the US government during the war in Afghanistan. But, at the policymaking level, a number of prominent moderate Republicans have championed the causes of other groups of Afghan refugees. Senator Susan Collins (R-ME) joined her colleague Senator Amy Klobuchar (D-MN) to write a letter urging the Biden administration to mobilize more resources to meet the needs of women refugees from Afghanistan, and Senator Mitt Romney (R-UT) has been a vocal advocate for evacuating and resettling Afghan journalists.
Steady Support for Ukrainian Refugee Admission
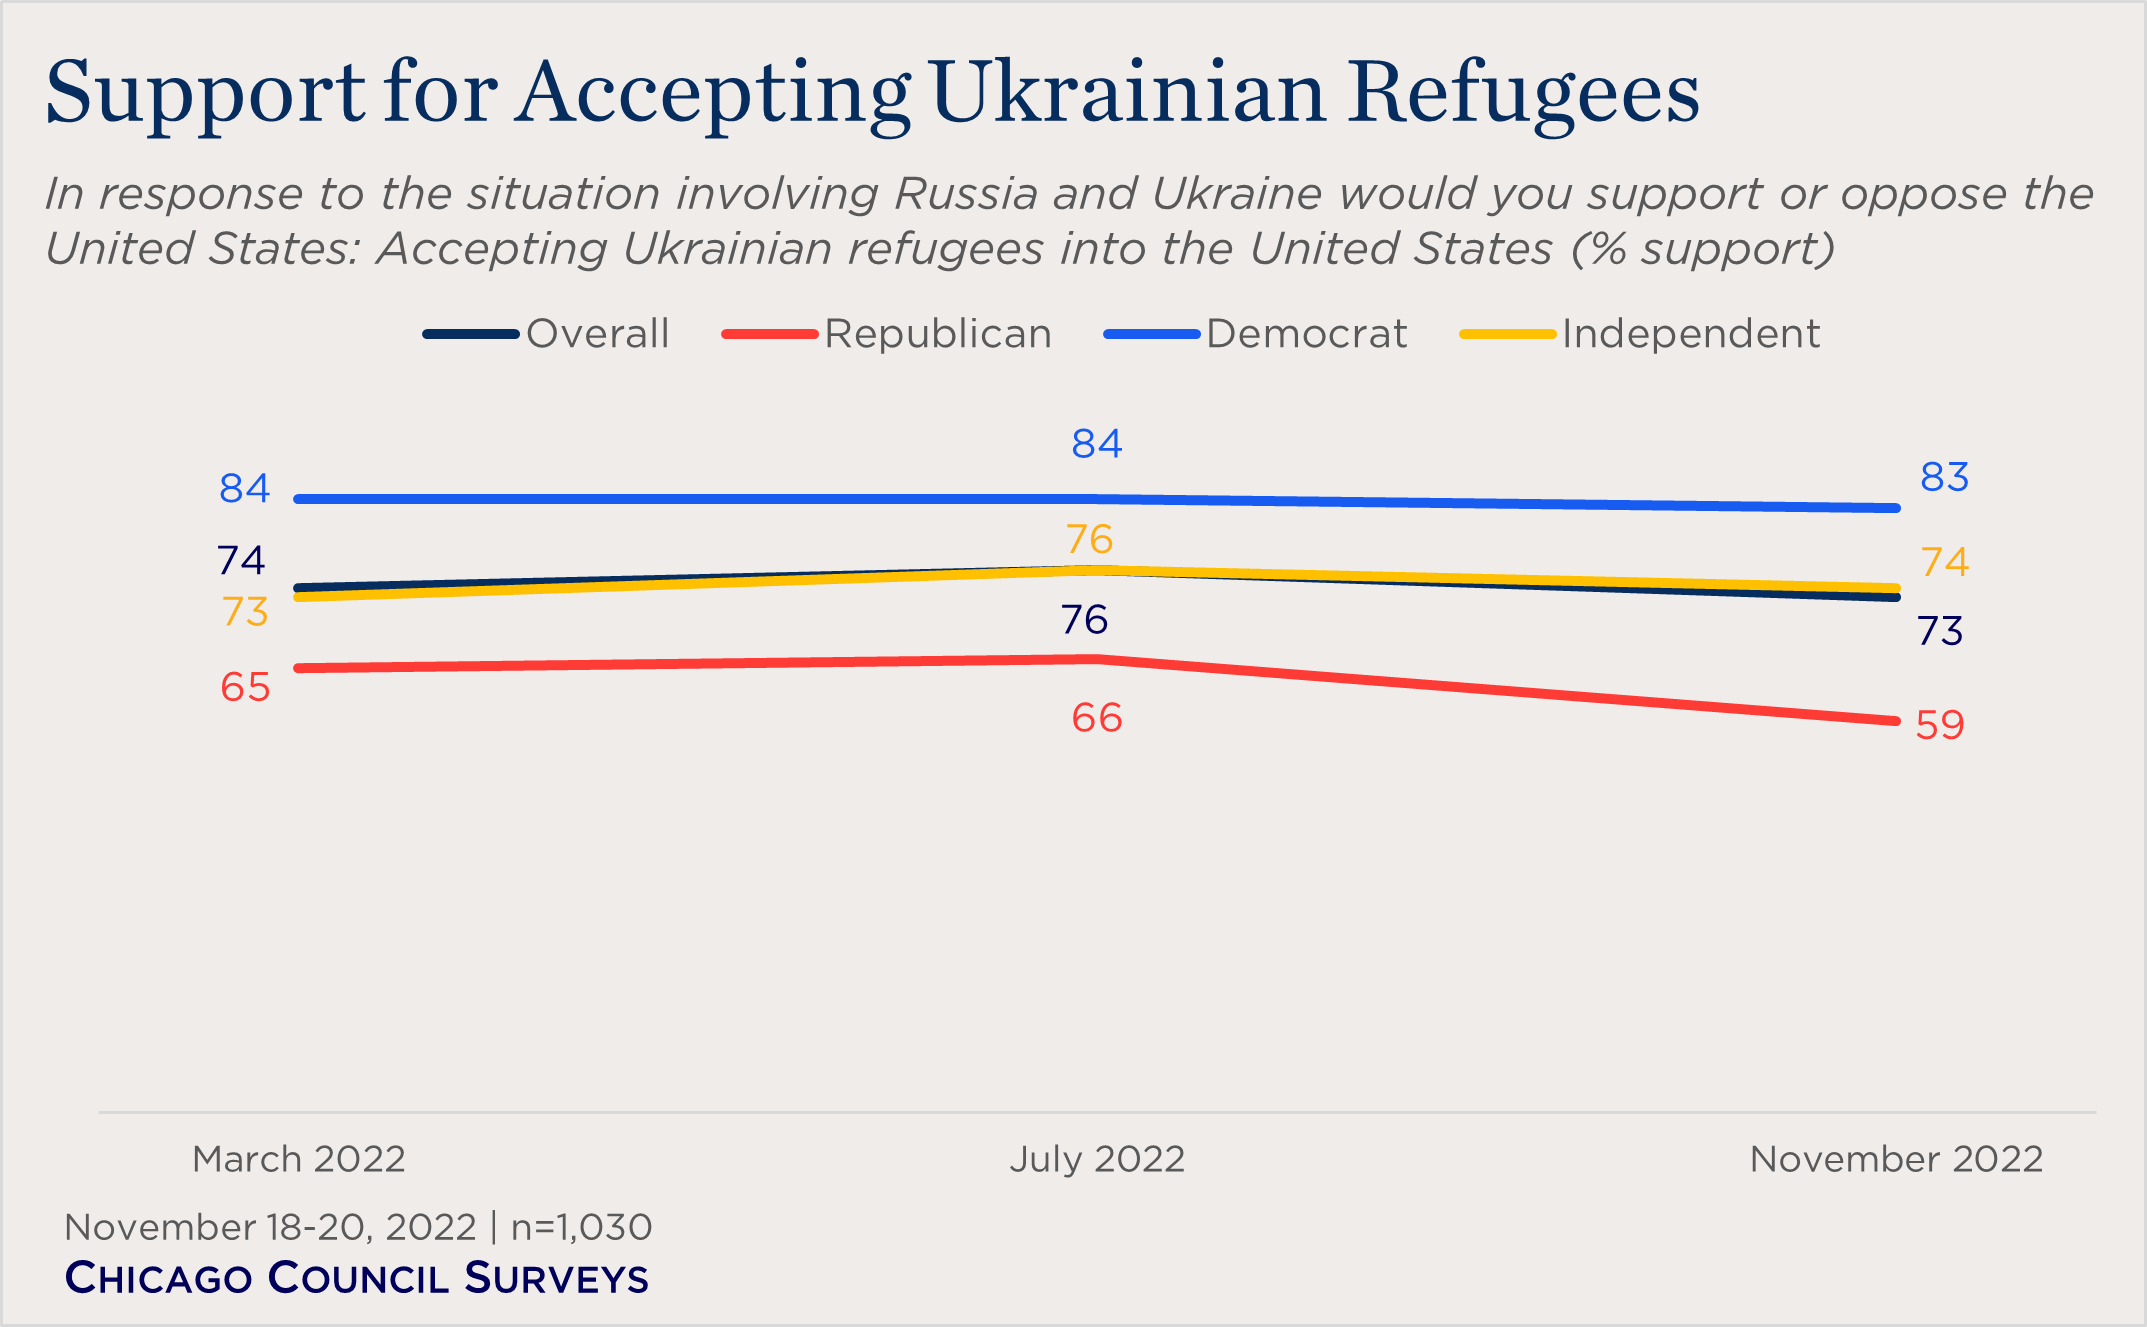
Lastly, despite growing divisions among the American public on providing Ukraine with economic and military aid, support for taking in Ukrainian refugees has hardly budged since March of this year. At the outset of the conflict, three-quarters of Americans (74%) favored accepting refugees from Ukraine; 73 percent say the same today. Nor has refugee admission seen the same kind of widening partisanship that other avenues of support for Ukraine have seen over the same time period. Moreover, in the Council’s November 18-20 survey, refugee admission was more popular among Americans of all political stripes than economic or military aid to Kyiv—and second only to increased sanctions on Russia.
A Complex Policy Mix
Support for accepting these refugee groups into the United States could be linked to the broader shift in American attitudes on immigration that has occurred since the turn of the 21st century. Over that period of time, American concerns about illegal immigration have steadily declined while support for legal immigration has risen. However, this shift in views has primarily occurred among Democrats and Independents. Republicans remain highly concerned about illegal immigration and are not inclined to increase legal immigration—a pattern that clearly appears in items about refugee admission as well.
As a whole, “Americans’ preferred refugee policy” is a difficult thing to define. Other surveys on US refugee policy make the complexity clear. In October 2021 polling from Quinnipiac, Americans opposed the Biden administration’s policy of deporting Haitians without allowing them to seek asylum (51%, 37% approved). And a CNN poll conducted April 28-May 1, 2022 finds that a majority of Americans support allowing refugees from central American countries to seek asylum in the United States (56%, down slightly from 63% in 2021). However, the same CNN poll also finds that a majority say the higher priority in US immigration policy should be minimizing the number of people trying to enter the United States (54%), rather than allowing people to seek asylum in the United States (45%).
These mixed priorities are also evident in public preferences for immigration policy as a whole. In the Pew Research Center’s 2022 National Survey of Latinos, Americans name a range of policies as important goals for American immigration policy. Topping the list: increased security along the US-Mexico border to reduce illegal crossings, with 73 percent of Americans naming it an important goal. At the same time, an identical proportion (73%) say that taking in civilian refugees from countries where people are trying to escape violence and war should be an important goal for US immigration policy.
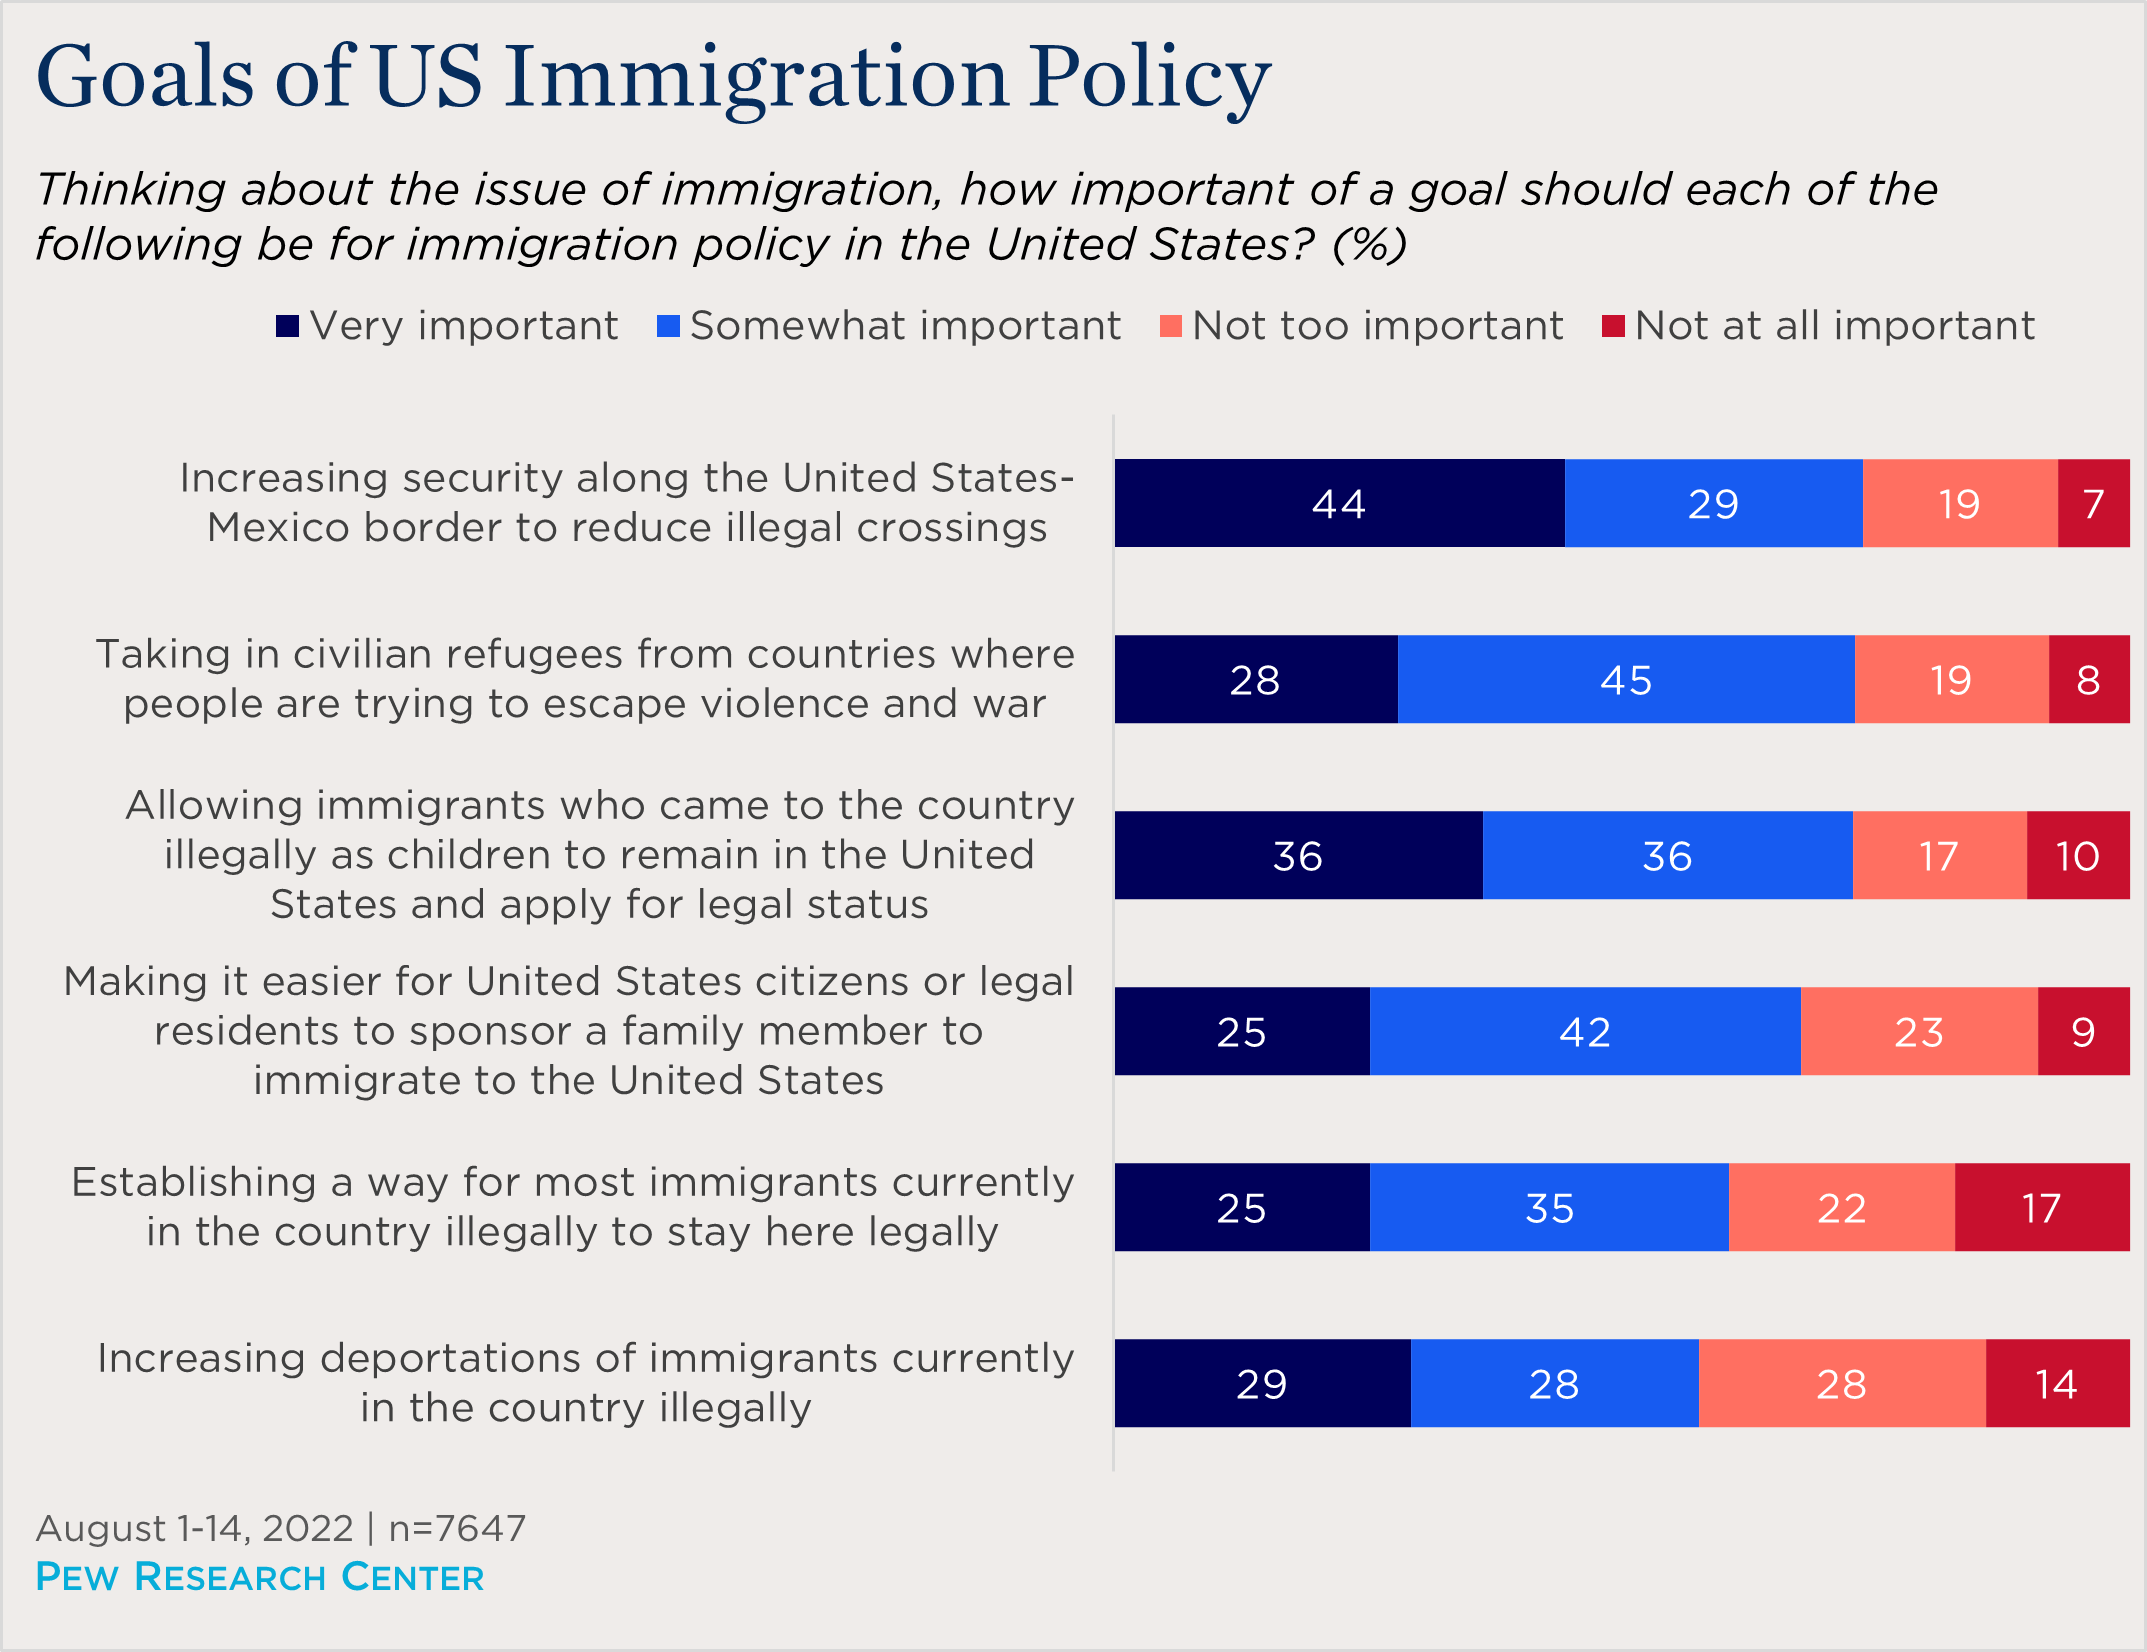
As Pew’s polling demonstrates, questions of legality also play a significant role in how Americans think about migration and refugee policy. Americans’ own partisan and ideological preferences, perceptions of the refugee’s country of origin, and their reason for emigrating all likely impact Americans’ views on which refugee groups to admit to the country. For Ukrainian refugees, that complicated mix of preferences has meant a high, relatively bipartisan, and steady level of support.


This analysis is primarily based on data from the 2022 Chicago Council Survey of the American public on foreign policy, a project of the Lester Crown Center on US Foreign Policy. The 2022 Chicago Council Survey was conducted July 15–August 1, 2022, by Ipsos using its large-scale nationwide online research panel, KnowledgePanel, in both English and Spanish among a weighted national sample of 3,106 adults 18 or older living in all 50 US states and the District of Columbia. The margin of sampling error for the full sample is +/- 1.8 percentage points. The margin of error is higher for partisan subgroups or for partial-sample items. The 2022 Chicago Council Survey was made possible by the generous support of the Crown family and the Korea Foundation.
Additional data comes from a survey conducted November 18-20, 2022 by Ipsos using its large-scale nationwide online research panel, KnowledgePanel, among a weighted national sample of 1,030 adults aged 18 or older living in all 50 US states and the District of Columbia. The margin of sampling error for the full sample is +/- 3.1 percentage points. The margin of error is higher for partisan subgroups or for partial-sample items. This survey was made possible by the generous support of the Carnegie Corporation of New York.
Partisan identification is based on how respondents answered a standard partisan self-identification question: “Generally speaking, do you think of yourself as a Republican, a Democrat, an Independent, or something else?”
Related Content
 Migration
But American concern about large numbers of immigrants and refugees coming into the country has steadily decreased over the past decades.
 Public Opinion
Why are Ukrainians receiving a warmer welcome from the American public than past refugee groups?
 Public Opinion
Consensus on how long to provide economic and military aid to Ukraine appears to be weakening as the war enters its tenth month.
 Public Opinion
The 2022 Chicago Council Survey finds broad support for taking in Afghan refugees but not for releasing frozen funds to the Taliban.