The American Thanksgiving Table

This Thanksgiving, the Council survey team is serving up tables of data on turkey, pies, and politics.
This week, most households in the United States will celebrate Thanksgiving. The holiday has been celebrated intermittently since the 18th century, and became a fixture of the November calendar following an 1863 proclamation by President Abraham Lincoln. Now observed (by law) on the fourth Thursday of November, Thanksgiving more so than any other US holiday revolves around the food: turkey, a spread of sides, and pie. And as a CBS News/SSRS poll in 2017 found, Thanksgiving is one of the things Americans most look forward to about the fall: 30 percent, tied for first with cooler weather (32%) and well ahead of football season (19%) or Halloween (11%).
Main Course: Turkey . . . for Days
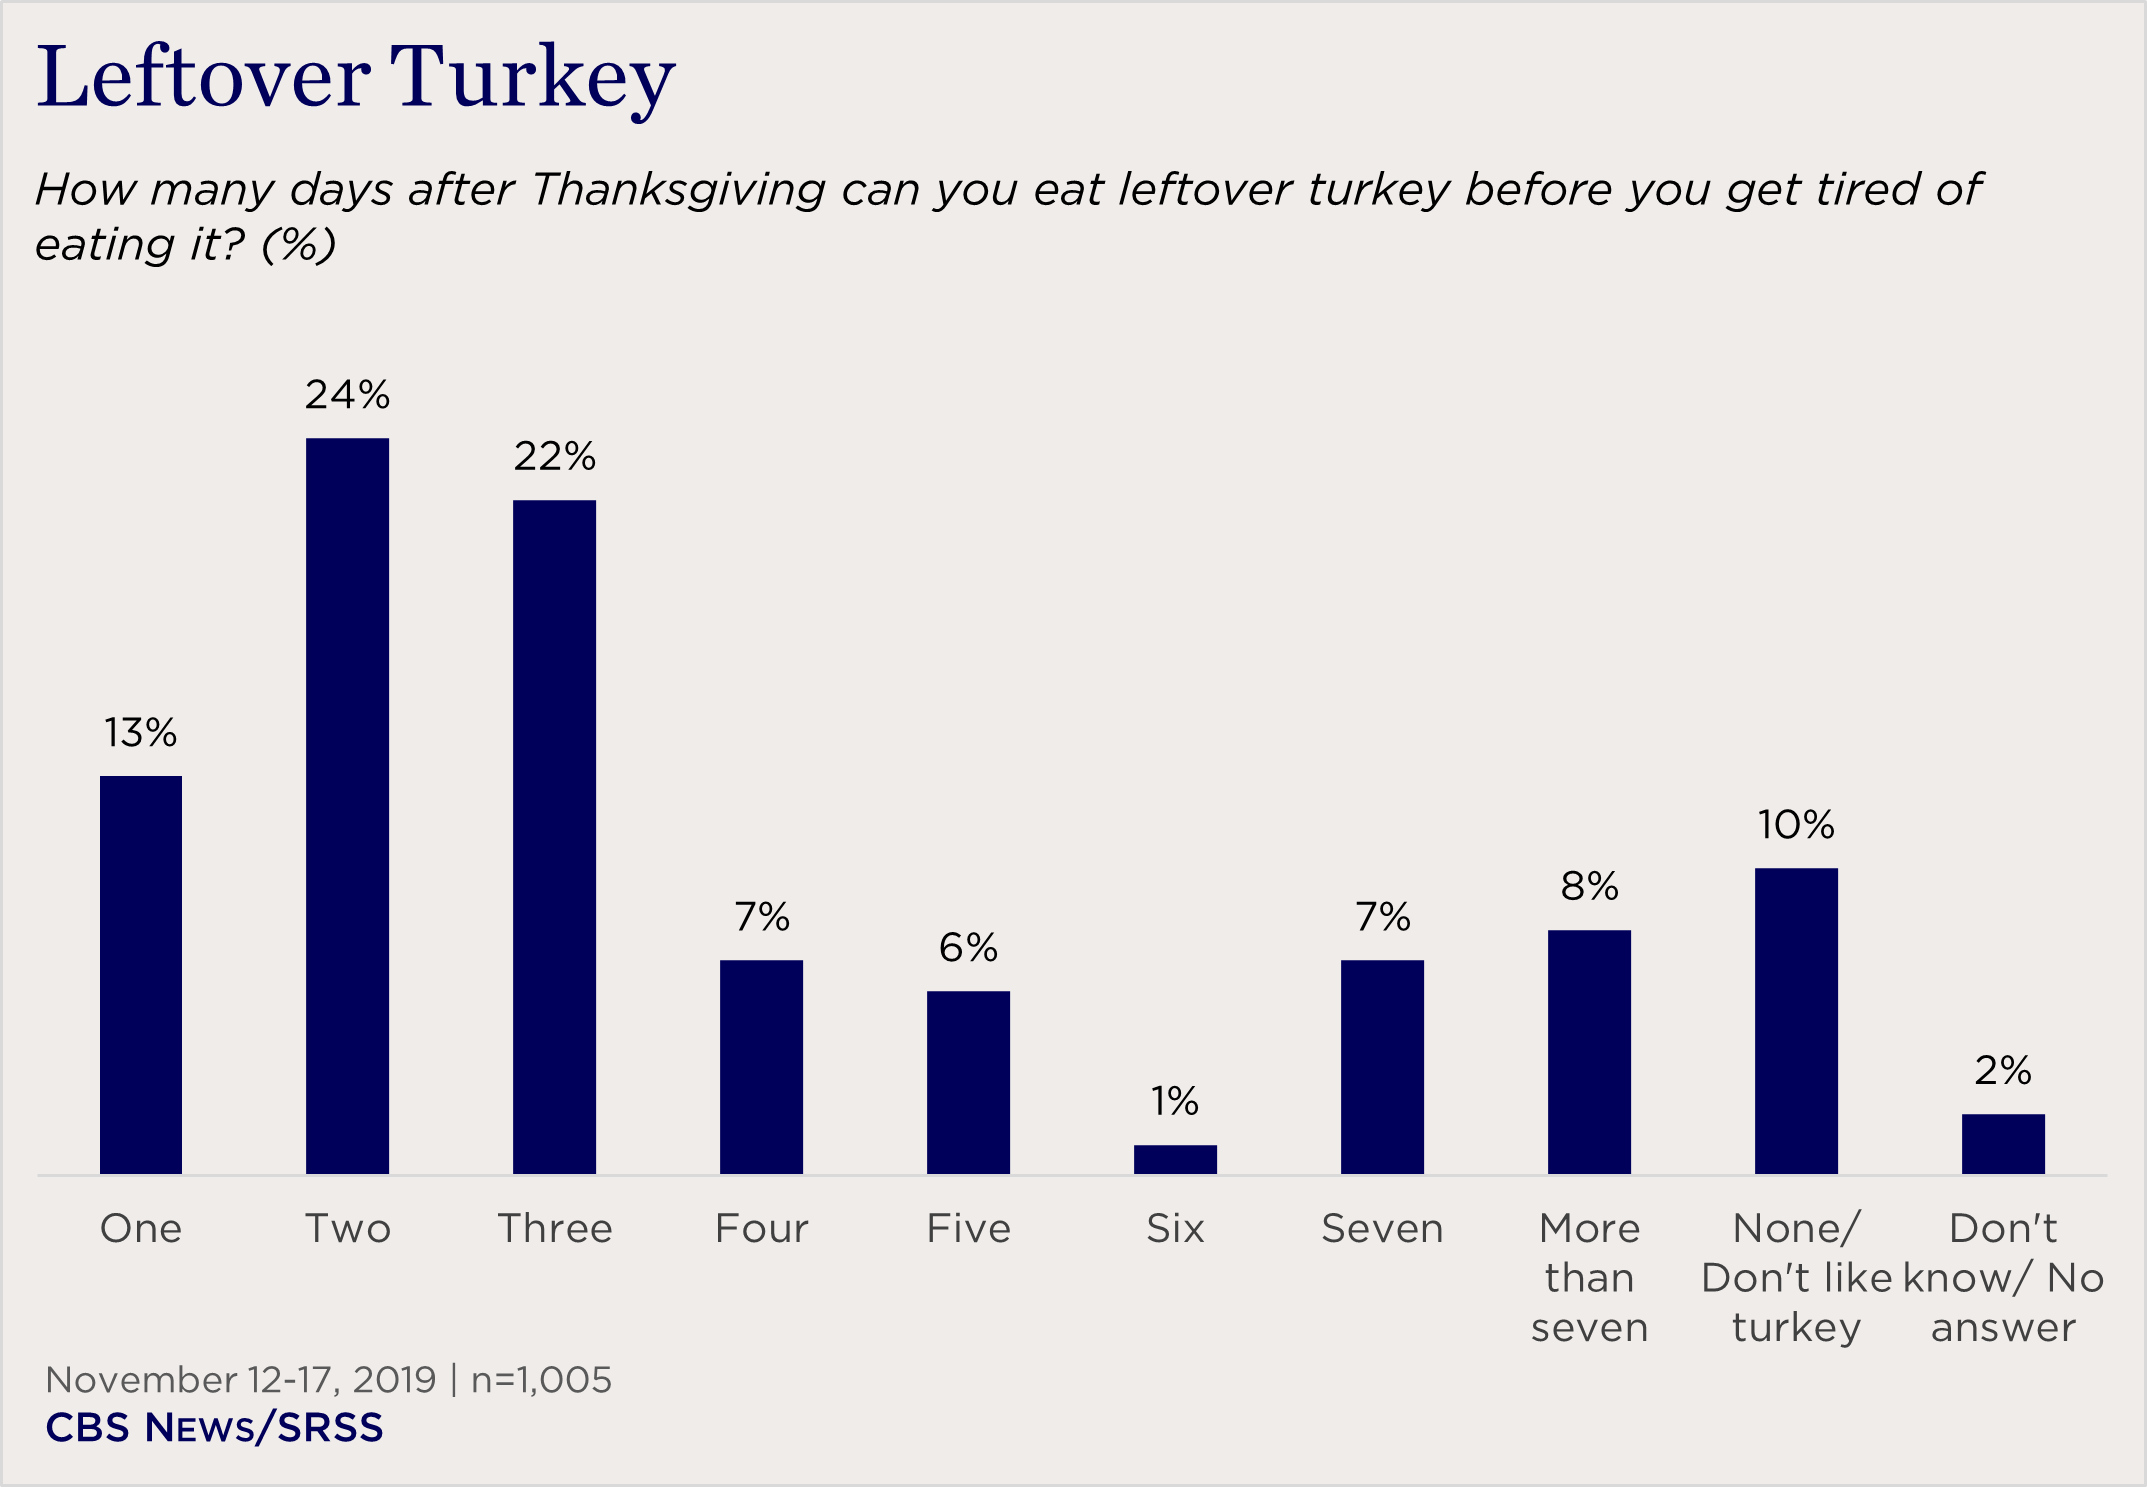
The Thanksgiving turkey, perhaps most famously depicted as the centerpiece of Norman Rockwell’s 1943 Freedom from Want, is an iconic image for Americans. Today, it remains a popular choice for most Americans. Per a 2019 CBS News/SRSS poll conducted two weeks before Thanksgiving, most Americans (73%) say they are happy eating turkey as the main course, while a quarter (25%) would rather eat something else. Of course, making a whole turkey also means lots of leftovers. A majority of Americans (59%) say they get tired of turkey after more than three days, though there is a smaller contingent (15%) that enjoy it for a week or more afterward.
Sides: Potatoes, Stuffing, Rolls, and Gravy Top the Table
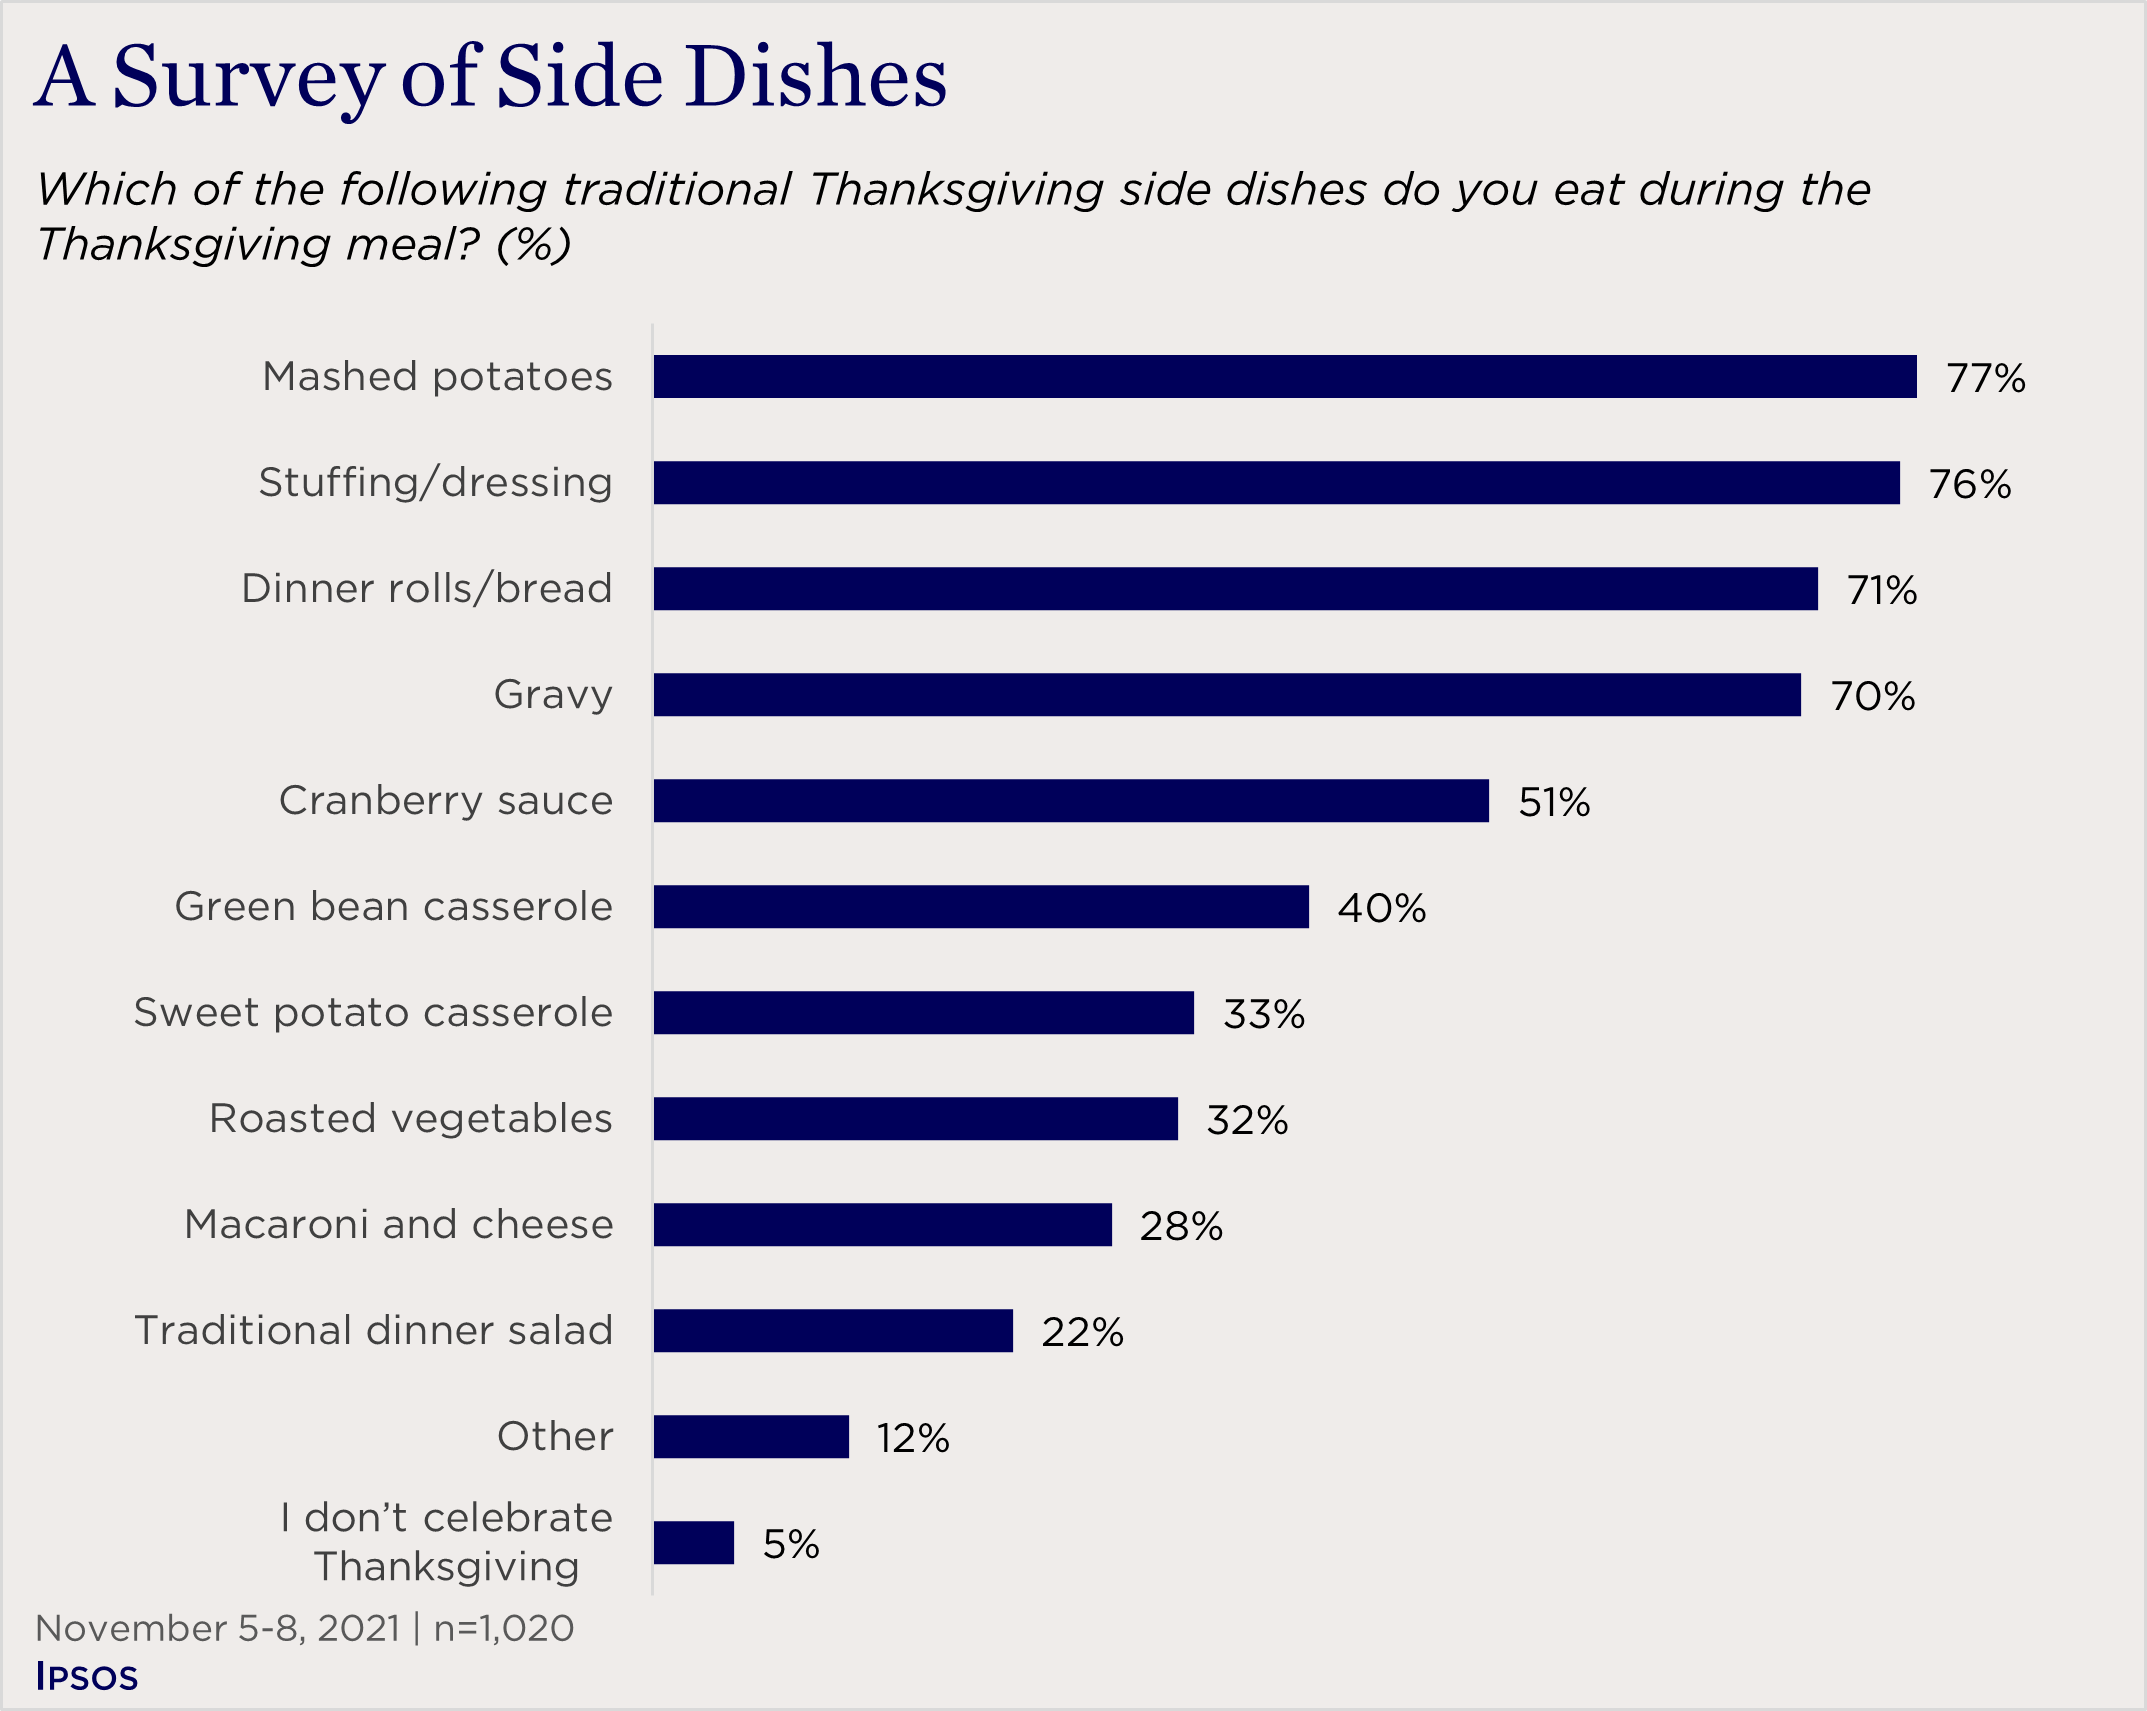
Though turkey is often the main course, the best part (in this pollster’s opinion) are the side dishes. Per a 2021 Ipsos survey, most tables this Thanksgiving will feature a lot in common: mashed potatoes (77%), stuffing (76%), rolls (71%), and gravy (70%). Half of Americans (51%) will also add a cranberry sauce to the plate. Beyond those core sides, there are a number of somewhat less-common dishes to accompany the meal. These include casseroles (either green bean or sweet potato), vegetables, mac and cheese, or a traditional salad.
Dessert: Pumpkin Pie Tops the List
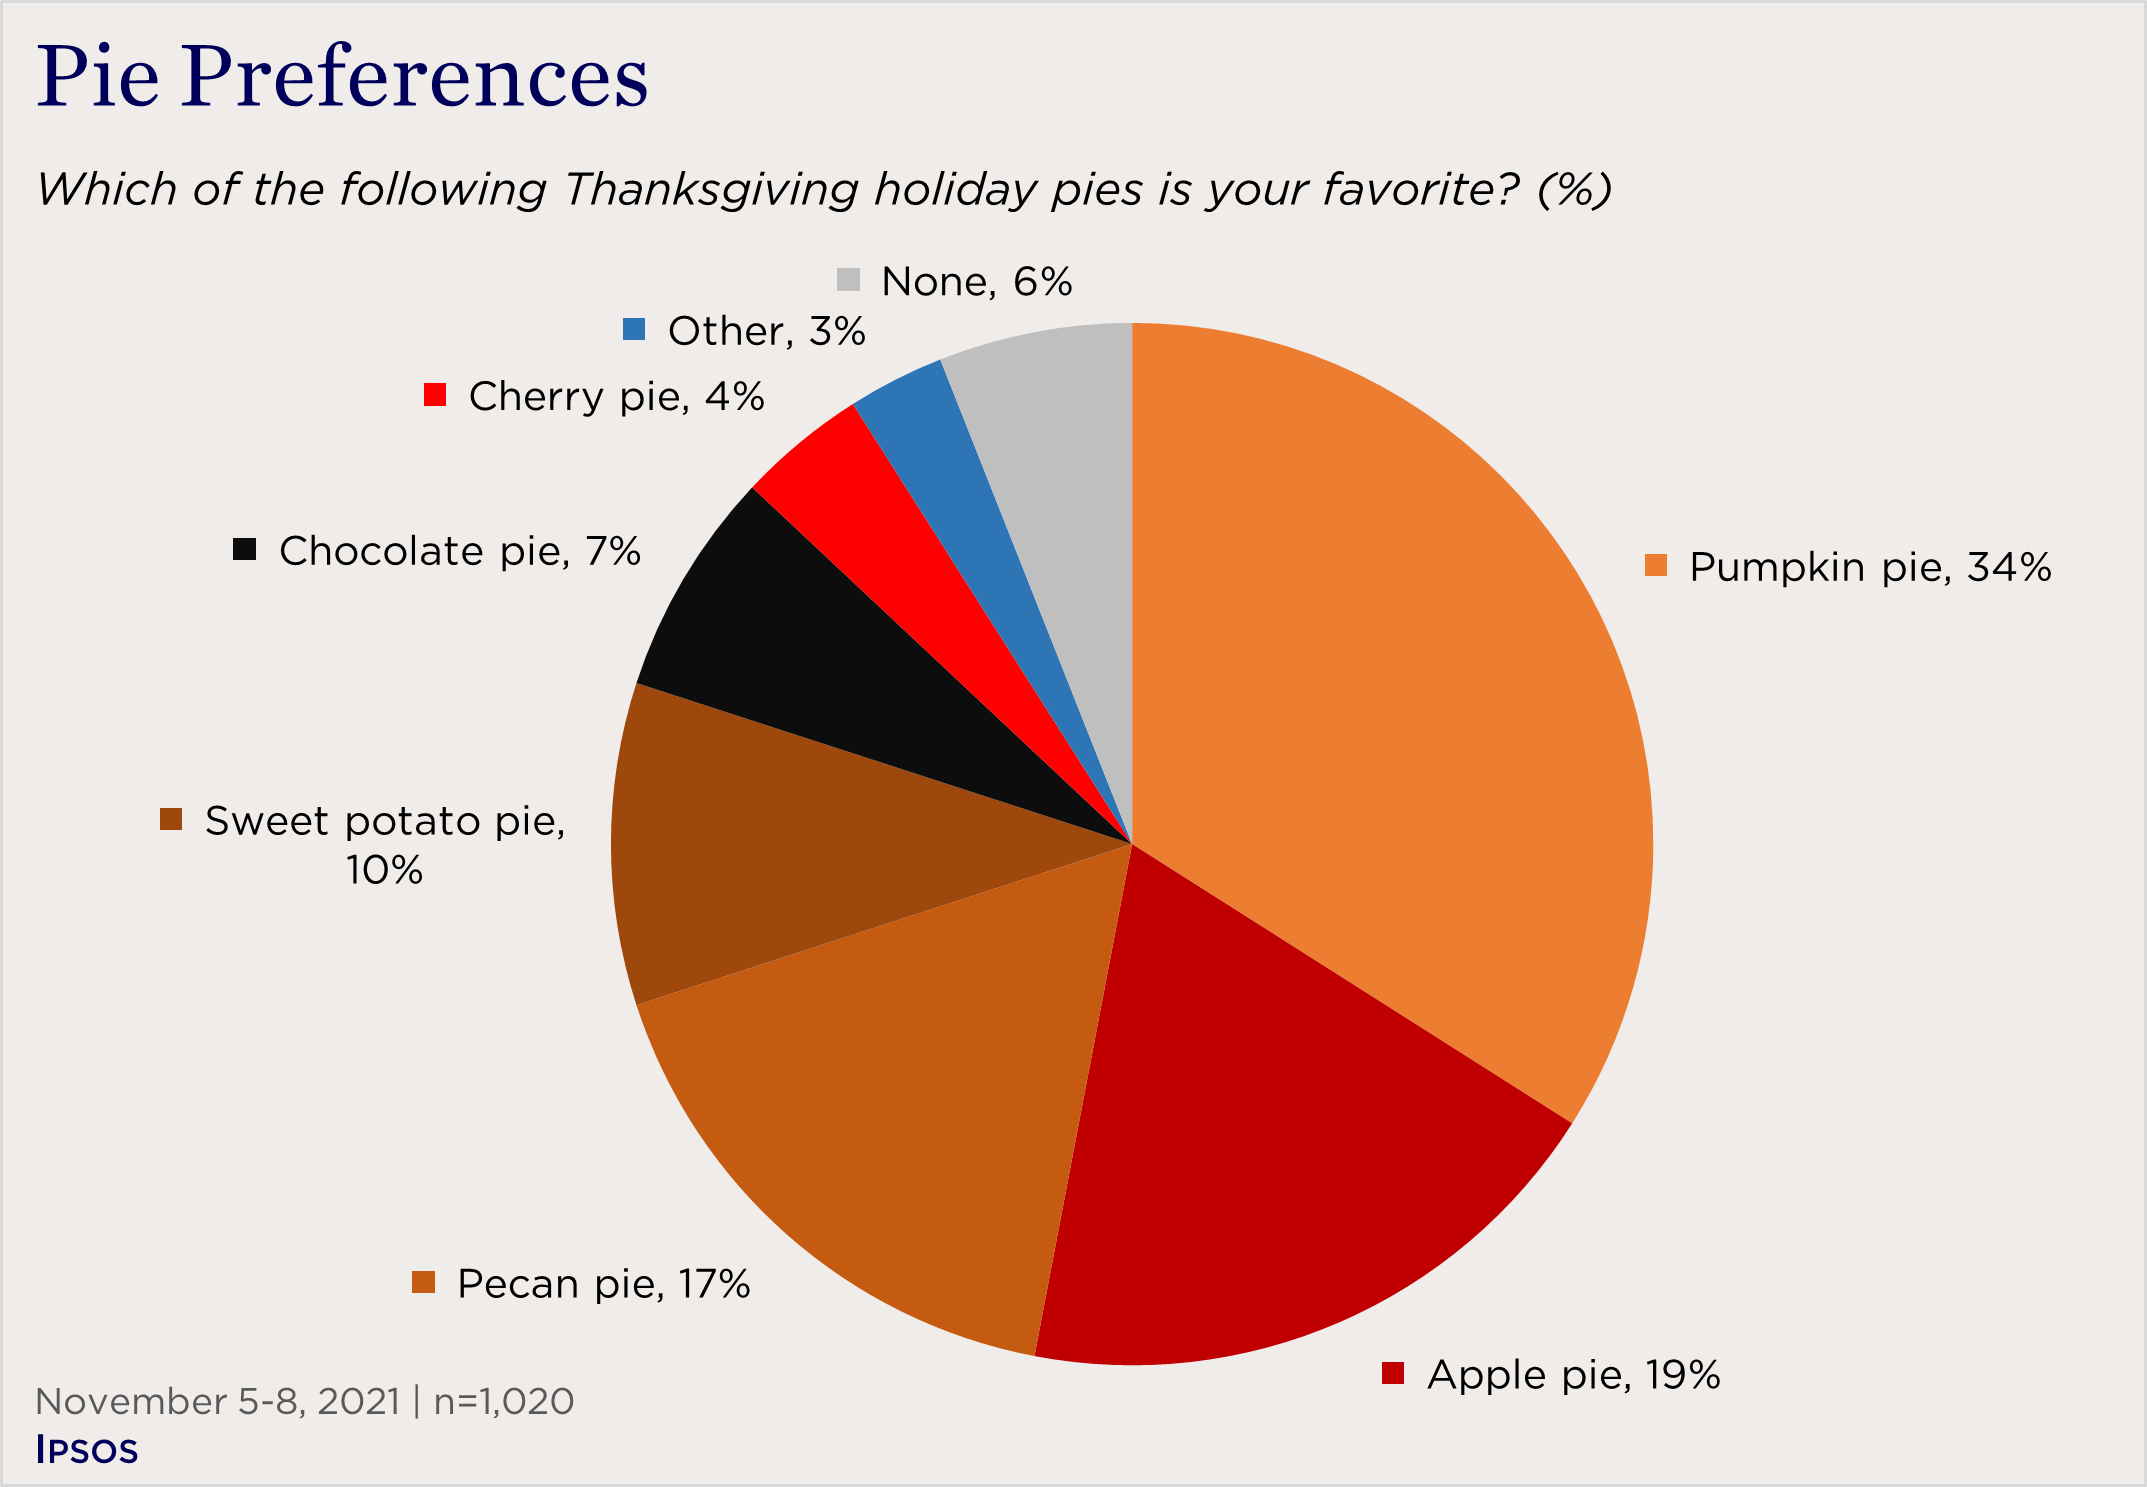
After a big Thanksgiving meal comes dessert, and for Thanksgiving that’s commonly a pie. Pumpkin pie, a seasonal classic whose spice flavoring is now synonymous with the fall season, is the favorite pie of a third of Americans (34%). In second come apple pie (19%) and pecan pie (17%), while another one in 10 opt for sweet potato pie.
These pie preferences vary somewhat by region. Pumpkin pie is most popular in the West (44%) and Midwest (39%) and though not included in this poll, I can attest to the popularity of rhubarb pie in some parts of the Midwest. In the Northeast, apple pie is a favorite for a third of people (33%), putting it on the same level as pumpkin pie (29%). And in the South, a quarter opt for pecan pie (23%), while another 14 percent opt for sweet potato pie (a traditional favorite of African American households throughout the South).
Politics? At Thanksgiving?
While everyone enjoys a full table of food, one sometimes unwelcome addition to the Thanksgiving meal—especially at large family gatherings—is politics. In a November 2021 Quinnipiac University survey, two-thirds of Americans (66%) said they hoped to avoid discussing politics at Thanksgiving, though two in 10 (21%) looked forward to such a discussion. For most Americans, though, politics isn’t likely to be on the menu: only a quarter (24%) said that heated political debate was likely to break out, and only nine percent thought it was very likely.
Americans, Giving Thanks
Aside from politics, another common topic around the Thanksgiving table is thankfulness and sharing what blessings in life one is thankful for. As a 2016 CNN/ORC survey found, Americans most often give thanks for family (64%), far and away the most common response. A quarter name health or being alive (27%), while one in eight give thanks for life in America (13%) or for work/education (12%).
I, for one, am thankful for polls like these (and Roper’s iPoll database, which collects them).
Have a happy Thanksgiving, everyone.